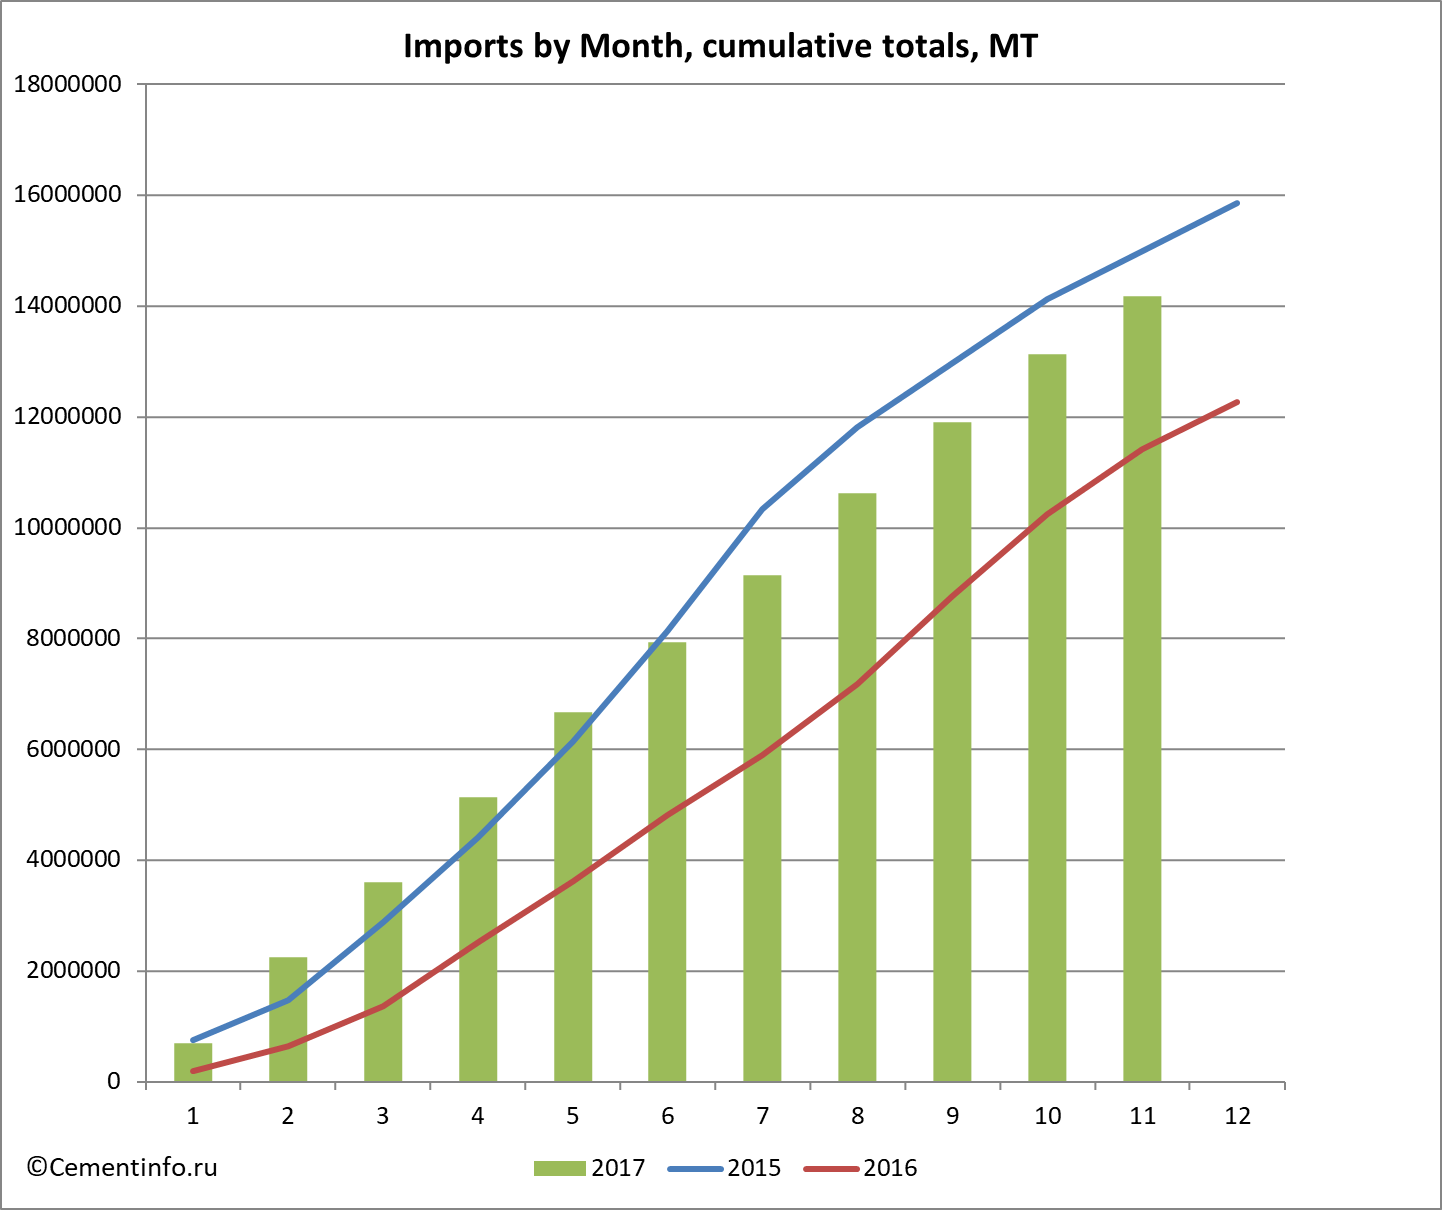
According to the analysis of customs declarations of FCS conducted by Cementinfo.ru, in November 2017 Russia has imported 1047.4 thousand tons of macadam. According to the results of 11 months of macadam import campaign, Russia has shipped in 14187.4 thousand tons (in 2016 - 11423.9 thousand MT; in 2015 - 14987.2 thousand MT).
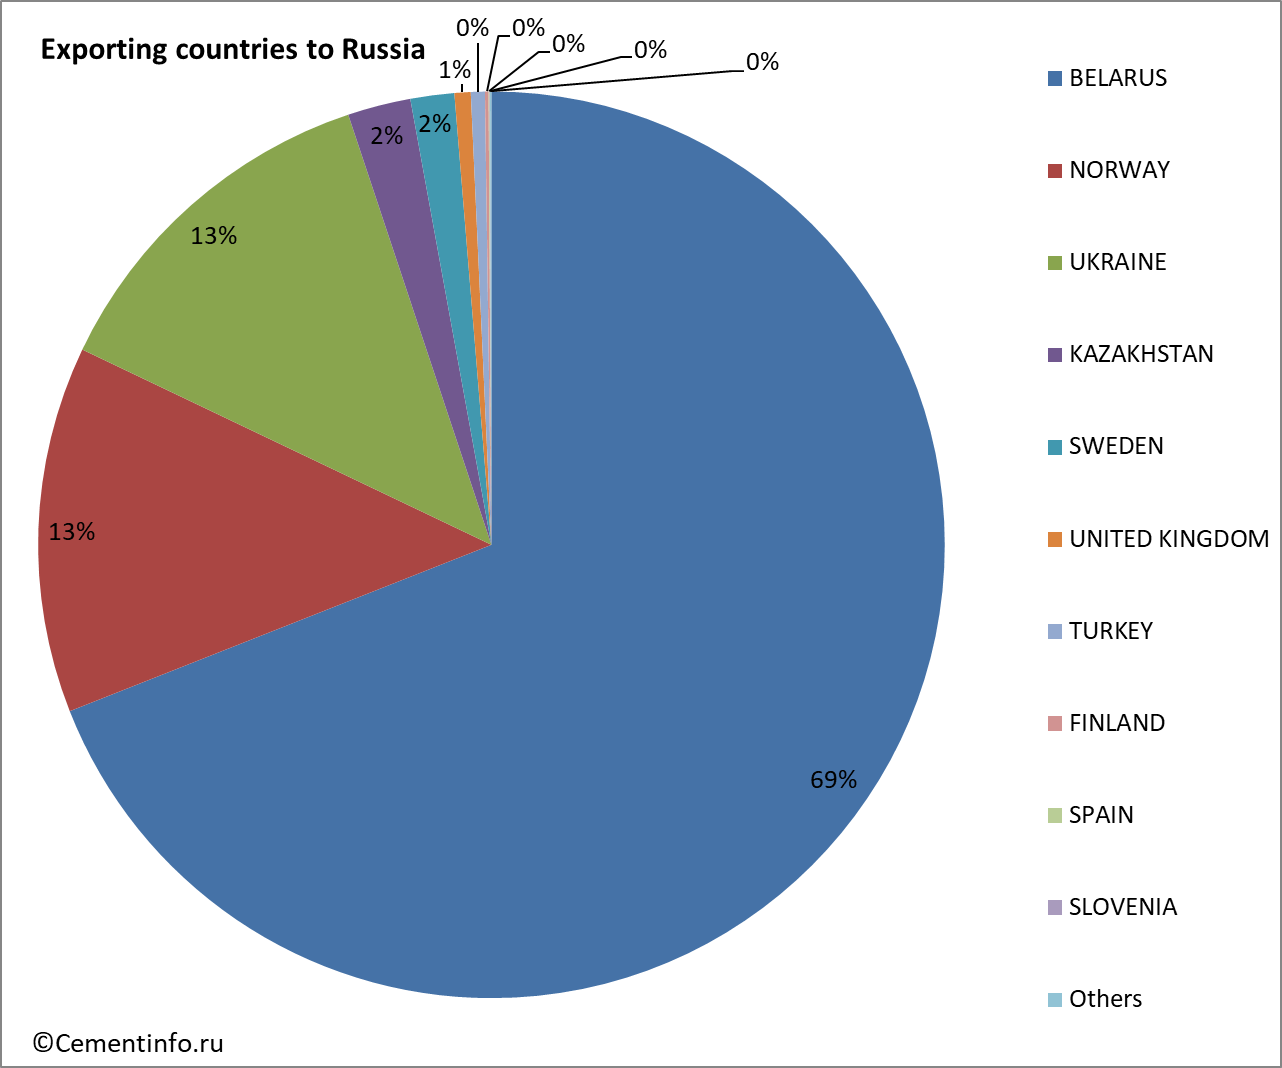
In the period January - November 2017, the main countries exporters of macadam to Russia were BELARUS (69.02%) and NORWAY (13.07%).
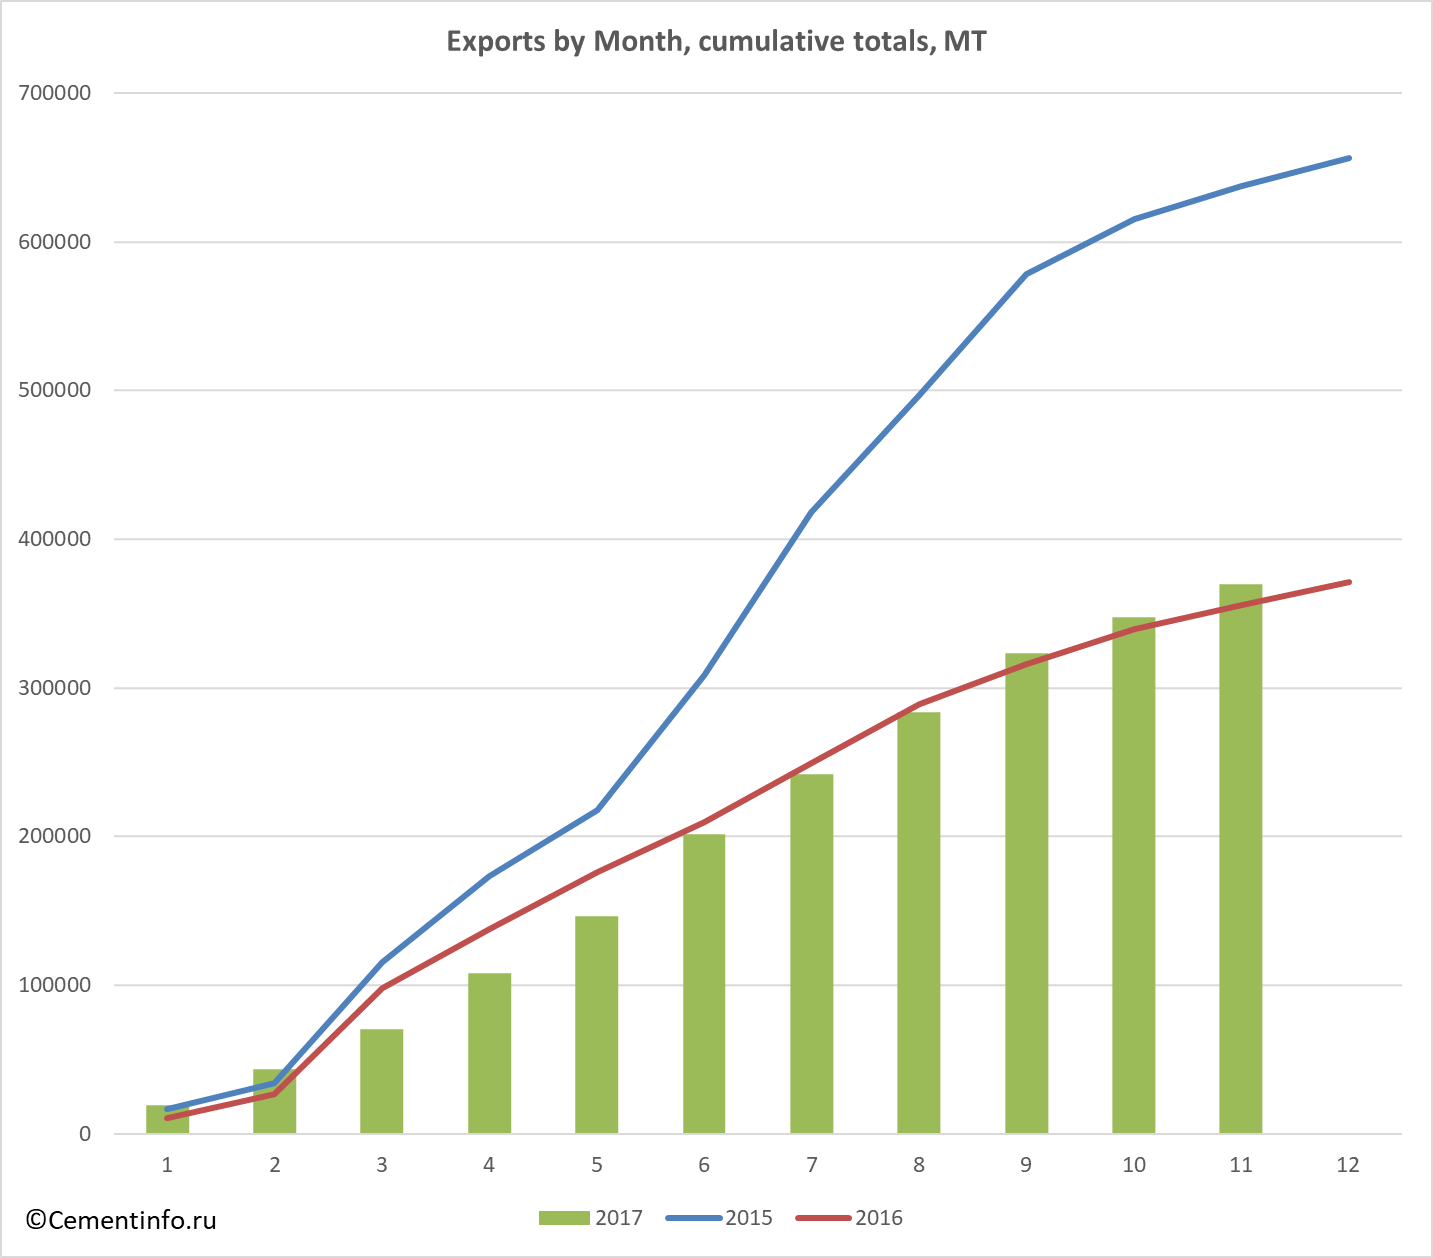
In November 2017 Russia has exported 369.8 thousand tons of macadam. According to the results of 11 months of macadam export campaign, Russia has shipped out 369.8 thousand tons (in 2016 - 355.7 thousand MT; in 2015 - 637.7 thousand MT).
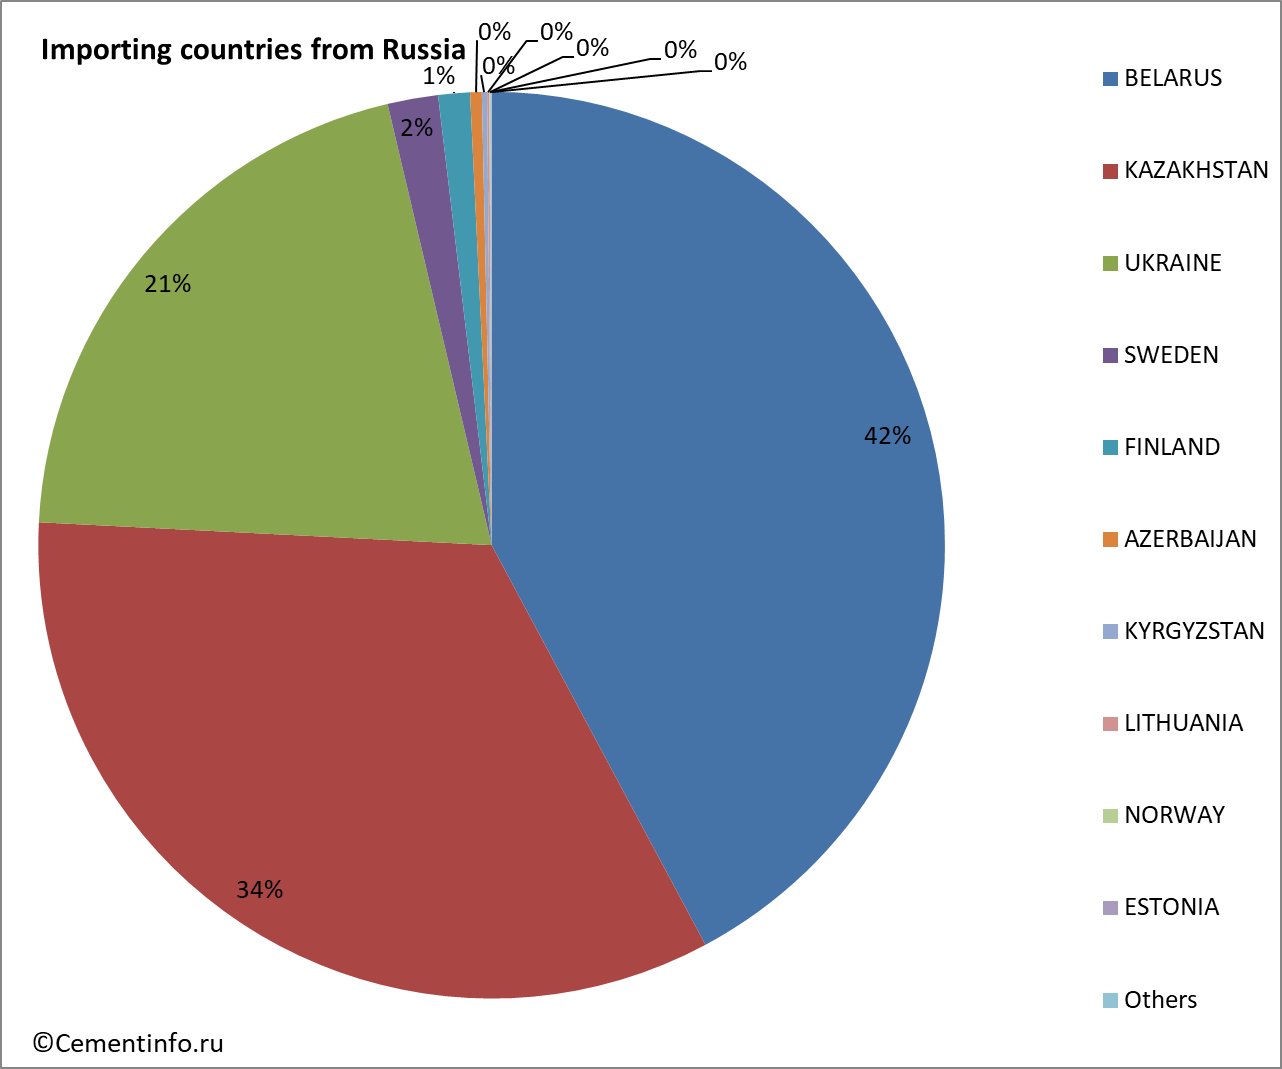
In the period January - November 2017, the main countries importers of macadam from Russia were BELARUS (42.18%) and KAZAKHSTAN (33.63%)..
Tables:
- Countries – exporters of macadam to Russia in January - November 2017, MT
- Countries – importers of macadam from Russia in January - November 2017, MT
- Exports of macadam to Russia by month, cumulative total, MT
- Imports of macadam from Russia by month, cumulative total, MT
Countries – exporters of macadam to Russia in January - November 2017, MT
| Exporting country to Russia, MT / year, month | 2015 | 2016 | 2017 | 2017 Total |
||||||||||
| 1 | 2 | 3 | 4 | 5 | 6 | 7 | 8 | 9 | 10 | 11 | ||||
| BELARUS | 3256655 | 8478586 | 573976 | 1371190 | 1090133 | 1155334 | 814944 | 684848 | 869249 | 1007793 | 866843 | 809319 | 548415 | 9792043 |
| NORWAY | 1172692 | 728296 | 101326 | 176450 | 182923 | 131157 | 172245 | 156487 | 301740 | 262873 | 150290 | 94449 | 123983 | 1853922 |
| UKRAINE | 10973968 | 2709609 | 69 | 55912 | 217517 | 419003 | 305622 | 20 | 68663 | 198849 | 257312 | 292790 | 1815757 | |
| KAZAKHSTAN | 105322 | 204281 | 3592 | 5592 | 5658 | 18300 | 47983 | 44497 | 30167 | 48484 | 43103 | 41351 | 30343 | 319070 |
| SWEDEN | 57422 | 77475 | 6698 | 7189 | 4844 | 9536 | 13189 | 36612 | 54558 | 24953 | 20732 | 43176 | 221487 | |
| UNITED KINGDOM | 310 | 244 | 17 | 42620 | 39267 | 14 | 90 | 31 | 82040 | |||||
| TURKEY | 115838 | 43191 | 4239 | 1895 | 4680 | 10512 | 10017 | 8059 | 5638 | 9348 | 5589 | 3102 | 7606 | 70684 |
| FINLAND | 115191 | 5389 | 4306 | 13932 | 18238 | |||||||||
| SPAIN | 2878 | 3955 | 244 | 210 | 348 | 301 | 404 | 344 | 437 | 272 | 894 | 353 | 484 | 4291 |
| SLOVENIA | 2028 | 4723 | 1660 | 702 | 312 | 2674 | ||||||||
| FRANCE | 1325 | 1704 | 852 | 890 | 60 | 98 | 40 | 1940 | ||||||
| POLAND | 1782 | 1493 | 18 | 74 | 162 | 210 | 135 | 231 | 225 | 103 | 94 | 75 | 1326 | |
| ESTONIA | 24865 | 2234 | 205 | 137 | 131 | 129 | 202 | 804 | ||||||
| CHINA | 6625 | 1059 | 19 | 21 | 52 | 13 | 27 | 293 | 245 | 670 | ||||
| AUSTRIA | 808 | 558 | 77 | 122 | 61 | 122 | 61 | 61 | 76 | 61 | 642 | |||
| CZECH REPUBLIC | 2555 | 518 | 53 | 106 | 106 | 126 | 97 | 73 | 72 | 632 | ||||
| INDIA | 384 | 65 | 14 | 463 | ||||||||||
| GERMANY | 1062 | 1060 | 15 | 15 | 11 | 59 | 38 | 25 | 31 | 19 | 45 | 22 | 280 | |
| NETHERLANDS | 732 | 196 | 40 | 11 | 40 | 78 | 169 | |||||||
| ITALY | 152 | 127 | 121 | 121 | ||||||||||
| JAPAN | 20 | 70 | 90 | |||||||||||
| INDONESIA | 26 | 26 | ||||||||||||
| PHILIPPINES | 106 | 22 | 22 | |||||||||||
| REPUBLIC OF KOREA | 425 | |||||||||||||
| ISRAEL | 57 | |||||||||||||
| ABKHAZIA | 13526 | |||||||||||||
| GEORGIA | 50 | 98 | ||||||||||||
| TURKMENISTAN | 67 | |||||||||||||
| LITHUANIA | 705 | |||||||||||||
| GREECE | 33 | 9697 | ||||||||||||
| BELGIUM | 148 | |||||||||||||
| USA | 53 | |||||||||||||
| EGYPT | 25 | |||||||||||||
| ARMENIA | 24 | |||||||||||||
| Total | 15857403 | 12274518 | 690235 | 1562736 | 1344647 | 1544628 | 1522394 | 1276251 | 1212157 | 1468137 | 1291278 | 1227531 | 1047397 | 14187391 |
 |
Countries – importers of macadam from Russia in January - November 2017, MT
| Exports from Russia (breakdown by importing countries), MT | 2015 | 2016 | 2017 | 2017 Total |
||||||||||
| 1 | 2 | 3 | 4 | 5 | 6 | 7 | 8 | 9 | 10 | 11 | ||||
| BELARUS | 43513 | 56750 | 2499 | 8089 | 5795 | 12790 | 16082 | 26218 | 24065 | 21620 | 12557 | 11662 | 14596 | 155972 |
| KAZAKHSTAN | 557731 | 243680 | 11407 | 10509 | 14336 | 14240 | 12636 | 17124 | 6266 | 9427 | 16324 | 6886 | 5189 | 124344 |
| UKRAINE | 41564 | 55438 | 3452 | 5988 | 6356 | 10401 | 9542 | 9004 | 9388 | 8936 | 8258 | 3211 | 1300 | 75836 |
| SWEDEN | 4854 | 3879 | 950 | 1995 | 636 | 1359 | 943 | 774 | 6657 | |||||
| FINLAND | 60 | 4670 | 520 | 20 | 30 | 42 | 21 | 40 | 2397 | 1059 | 40 | 4168 | ||
| AZERBAIJAN | 1634 | 1150 | 298 | 60 | 138 | 260 | 50 | 392 | 53 | 291 | 1542 | |||
| KYRGYZSTAN | 173 | 174 | 20 | 85 | 20 | 20 | 108 | 41 | 20 | 110 | 61 | 197 | 681 | |
| LITHUANIA | 1505 | 297 | 11 | 39 | 149 | 12 | 19 | 16 | 20 | 33 | 299 | |||
| NORWAY | 80 | 80 | ||||||||||||
| ESTONIA | 80 | 140 | 13 | 18 | 18 | 13 | 62 | |||||||
| MOLDOVA | 136 | 134 | 21 | 18 | 20 | 59 | ||||||||
| CYPRUS | 48 | 48 | ||||||||||||
| ABKHAZIA | 161 | 3141 | 23 | 23 | ||||||||||
| TAJIKISTAN | 456 | 65 | 15 | 15 | ||||||||||
| UZBEKISTAN | 120 | 60 | ||||||||||||
| GEORGIA | 19 | |||||||||||||
| CZECH REPUBLIC | 994 | 823 | ||||||||||||
| SOUTH OSSETIA | 418 | |||||||||||||
| CHINA | 2750 | |||||||||||||
| LATVIA | 18 | 397 | ||||||||||||
| Total | 656188 | 370799 | 19157 | 24586 | 26631 | 37703 | 38472 | 54787 | 40506 | 41490 | 40126 | 23928 | 22399 | 369786 |
 |
Exports of macadam to Russia by month, cumulative total, MT
| Exports by Month, cumulative totals, MT | 2015 | 2016 | 2017 |
| jan | 16866 | 10552 | 19157 |
| feb | 34194 | 26806 | 43743 |
| mar | 115323 | 97810 | 70374 |
| apr | 173374 | 137490 | 108077 |
| may | 217915 | 176165 | 146549 |
| jun | 308447 | 209605 | 201336 |
| jul | 418239 | 249191 | 241842 |
| aug | 496828 | 289282 | 283333 |
| sep | 578285 | 316051 | 323459 |
| oct | 615502 | 339596 | 347387 |
| nov | 637707 | 355699 | 369786 |
| dec | 656188 | 370799 |
 |
Imports of macadam from Russia by month, cumulative total, MT
| Imports by Month, cumulative totals, MT | 2015 | 2016 | 2017 |
| jan | 746996 | 195387 | 690235 |
| feb | 1478591 | 651758 | 2252971 |
| mar | 2887806 | 1370926 | 3597618 |
| apr | 4409268 | 2523011 | 5142246 |
| may | 6144360 | 3629331 | 6664640 |
| jun | 8138097 | 4822302 | 7940891 |
| jul | 10328491 | 5902619 | 9153048 |
| aug | 11814113 | 7178763 | 10621185 |
| sep | 12965543 | 8771887 | 11912463 |
| oct | 14123241 | 10242991 | 13139995 |
| nov | 14987189 | 11423942 | 14187391 |
| dec | 15857403 | 12274518 |
 |