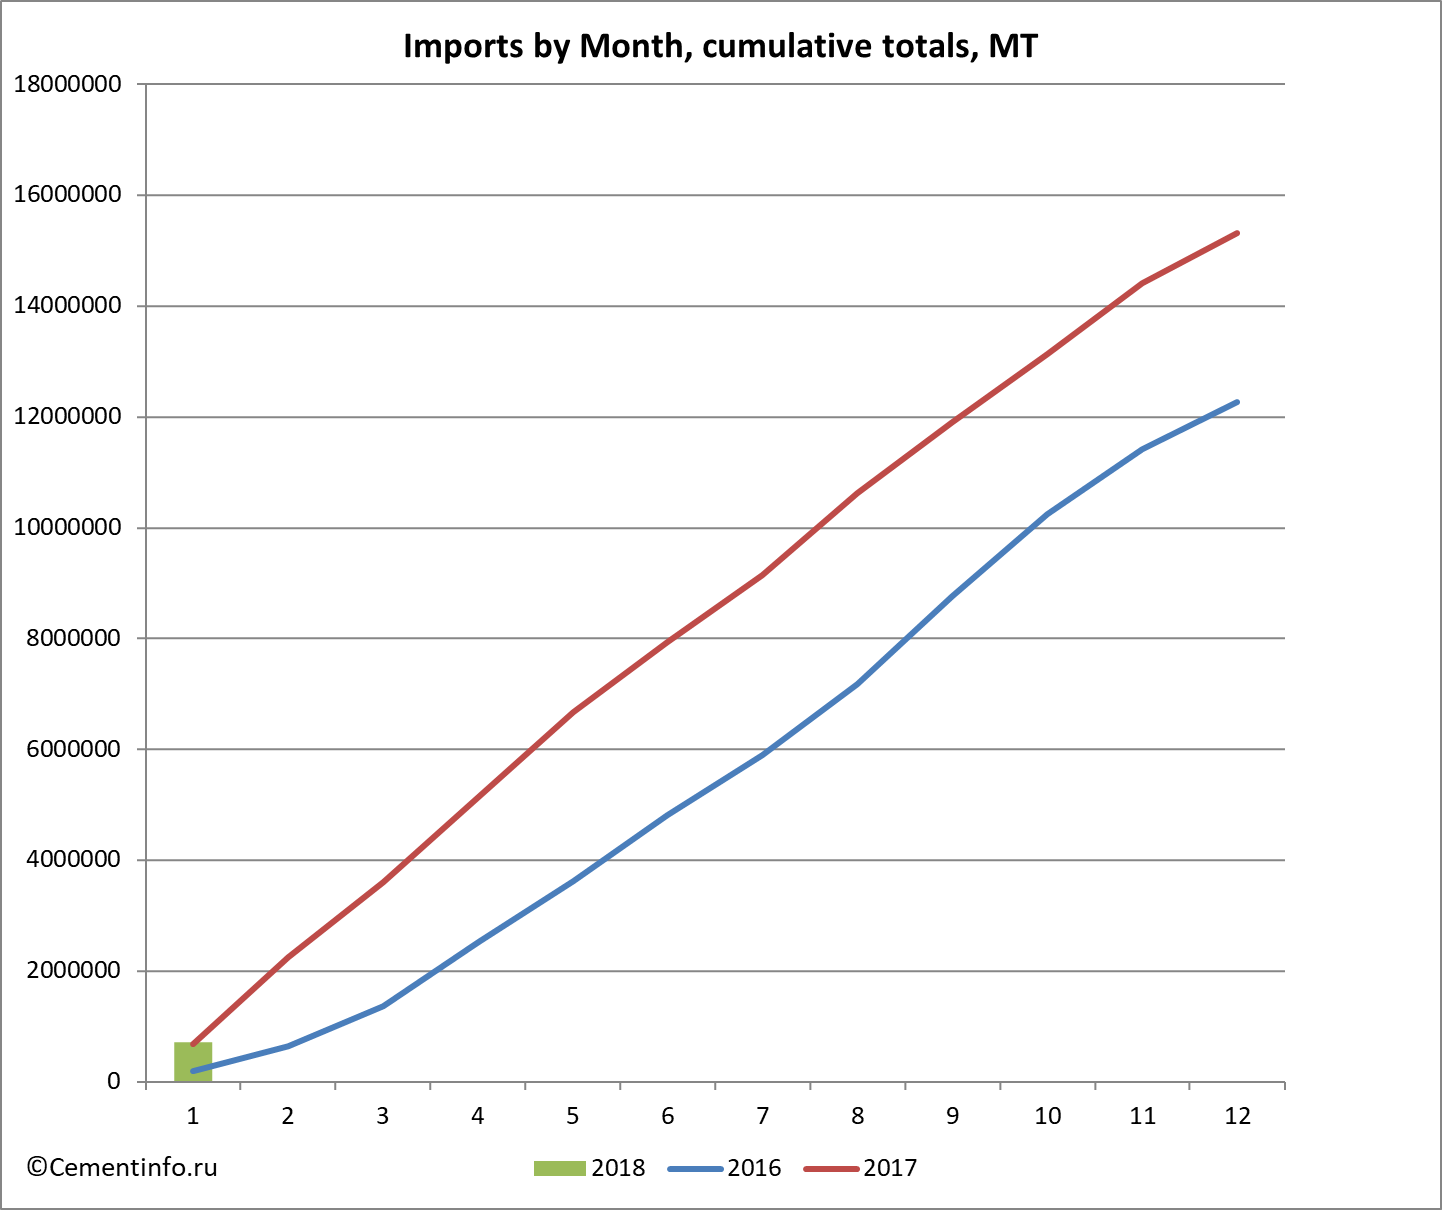
According to the analysis of customs declarations of FCS conducted by Cementinfo.ru, in January 2018 Russia has imported 713.2 thousand tons of macadam. According to the results of 1 months of macadam import campaign, Russia has shipped in 713.2 thousand tons (in 2017 - 690.2 thousand MT; in 2016 - 195.4 thousand MT).
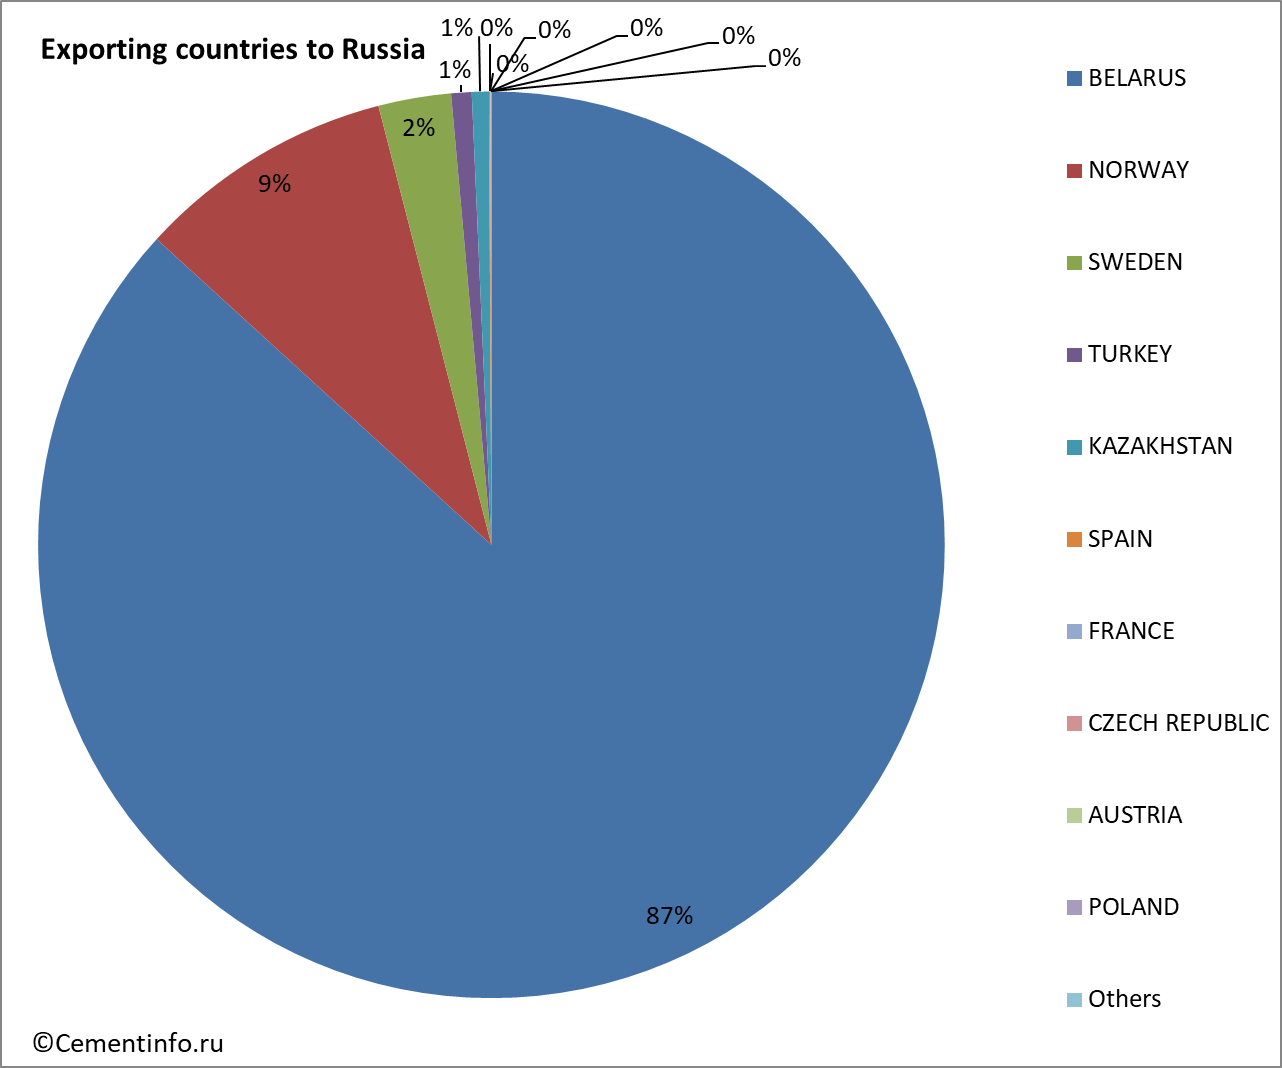
In the period January, the main countries exporters of macadam to Russia were BELARUS (86.78%) and NORWAY (9.21%).
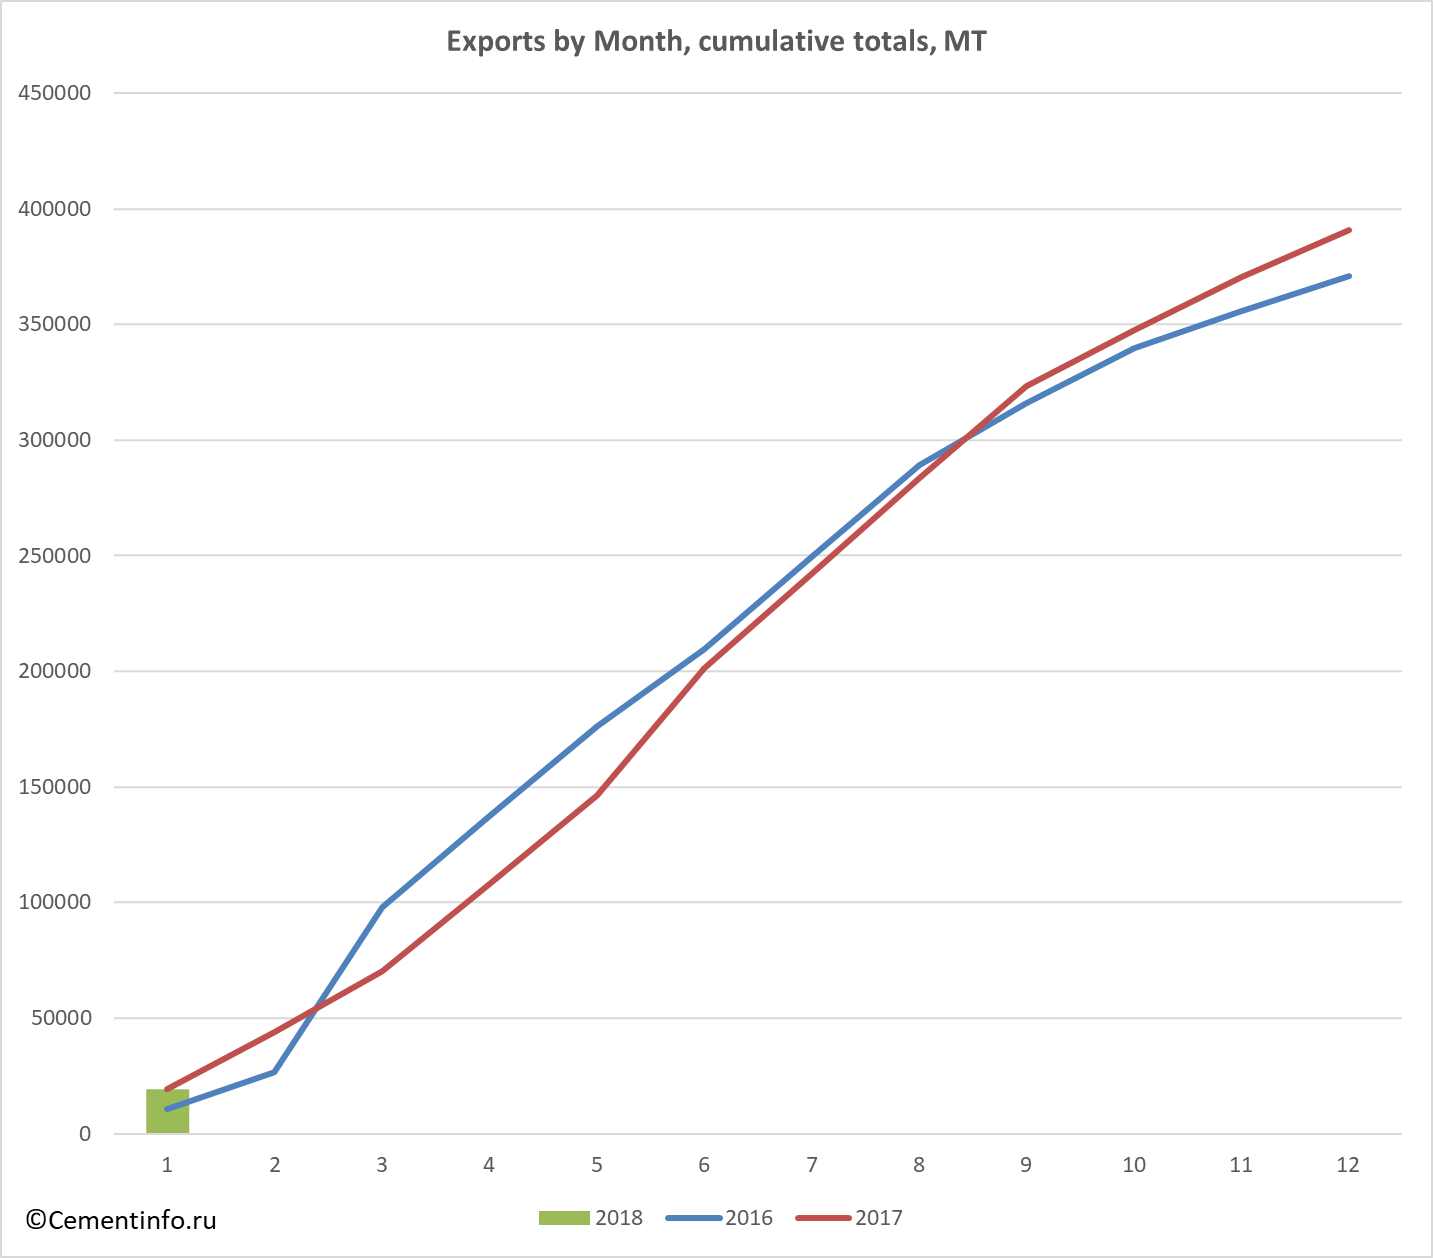
In January 2018 Russia has exported 19.1 thousand tons of macadam. According to the results of 1 months of macadam export campaign, Russia has shipped out 19.1 thousand tons (in 2017 - 19.2 thousand MT; in 2016 - 10.6 thousand MT).
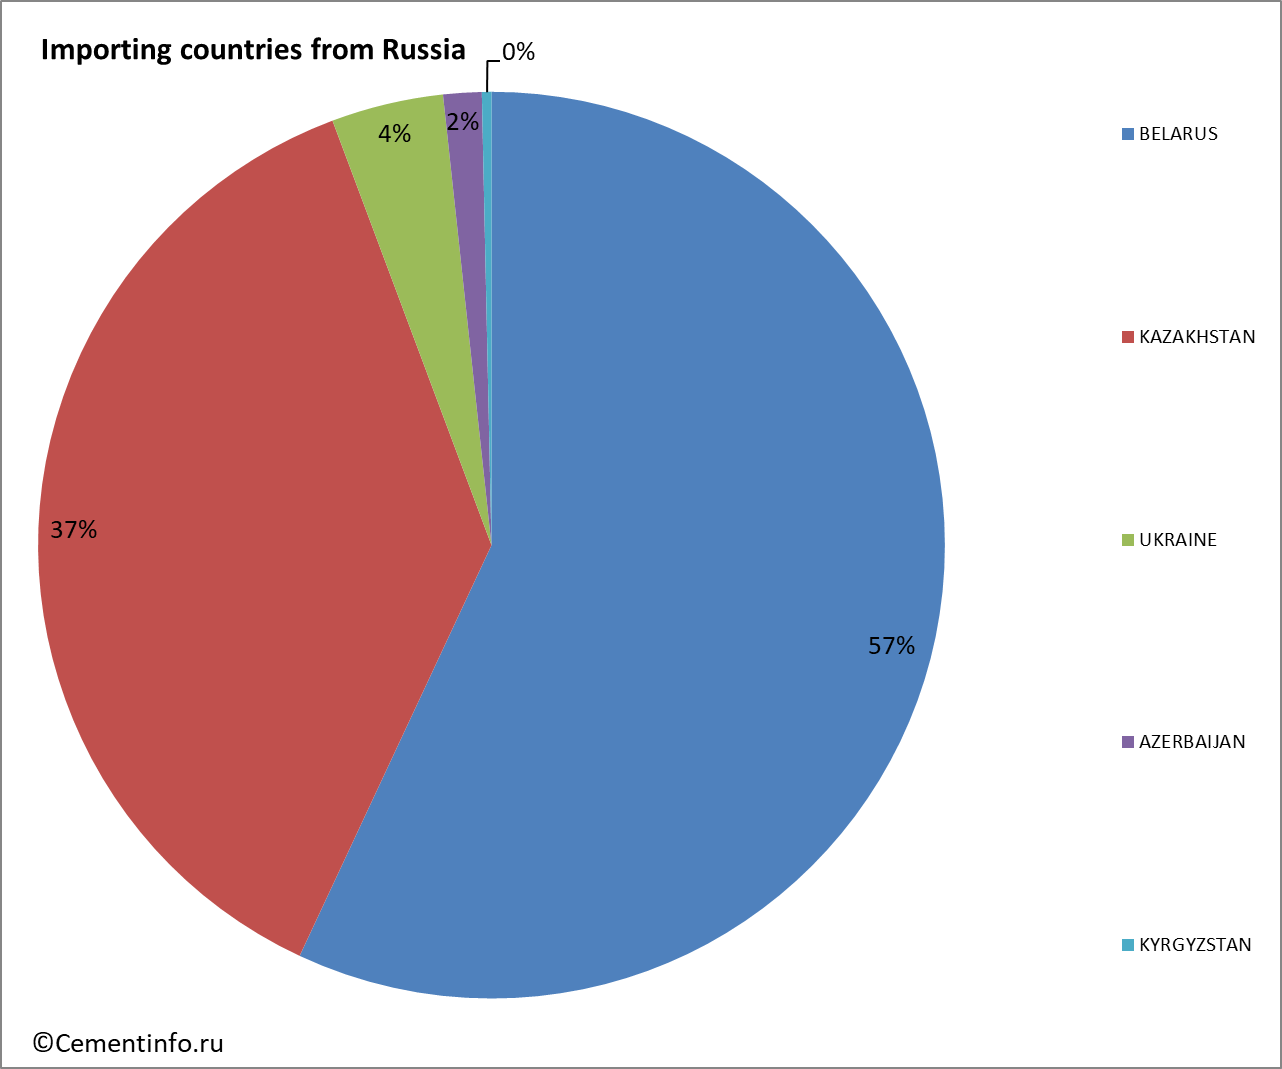
In the period January, the main countries importers of macadam from Russia were BELARUS (56.96%) and KAZAKHSTAN (37.34%)..
Tables:
- Countries – exporters of macadam to Russia in January, MT
- Countries – importers of macadam from Russia in January, MT
- Exports of macadam to Russia by month, cumulative total, MT
- Imports of macadam from Russia by month, cumulative total, MT
Countries – exporters of macadam to Russia in January, MT
| Exporting country to Russia, MT / year, month | 2016 | 2017 | 2018 | 2018 Total |
| 1 | ||||
| BELARUS | 8478586 | 10425412 | 618932 | 618932 |
| NORWAY | 728296 | 1935748 | 65695 | 65695 |
| SWEDEN | 77475 | 234214 | 18468 | 18468 |
| TURKEY | 43191 | 72767 | 5198 | 5198 |
| KAZAKHSTAN | 204281 | 326567 | 4325 | 4325 |
| SPAIN | 3955 | 4391 | 322 | 322 |
| FRANCE | 1704 | 2590 | 89 | 89 |
| CZECH REPUBLIC | 518 | 632 | 73 | 73 |
| AUSTRIA | 558 | 642 | 60 | 60 |
| POLAND | 1493 | 1391 | 55 | 55 |
| UKRAINE | 2709609 | 2201754 | 20 | 20 |
| GREECE | 9697 | |||
| BELGIUM | 43 | |||
| PHILIPPINES | 22 | |||
| EGYPT | 25 | |||
| UNITED KINGDOM | 244 | 82088 | ||
| FINLAND | 5389 | 18238 | ||
| ESTONIA | 2234 | 939 | ||
| GEORGIA | 98 | |||
| GERMANY | 1060 | 292 | ||
| INDONESIA | 26 | |||
| NETHERLANDS | 196 | 189 | ||
| CHINA | 1059 | 670 | ||
| JAPAN | 90 | |||
| SLOVENIA | 4723 | 3377 | ||
| ITALY | 127 | 121 | ||
| INDIA | 463 | |||
| Total | 12274518 | 15312665 | 713235 | 713235 |
 |
Countries – importers of macadam from Russia in January, MT
| Exports from Russia (breakdown by importing countries), MT | 2016 | 2017 | 2018 | 2018 Total |
| 1 | ||||
| BELARUS | 56750 | 172293 | 10878 | 10878 |
| KAZAKHSTAN | 243680 | 127267 | 7131 | 7131 |
| UKRAINE | 55438 | 76734 | 763 | 763 |
| AZERBAIJAN | 1150 | 2170 | 262 | 262 |
| KYRGYZSTAN | 174 | 815 | 65 | 65 |
| CZECH REPUBLIC | 823 | 20 | ||
| FINLAND | 4670 | 4168 | ||
| MOLDOVA | 134 | 59 | ||
| NORWAY | 80 | |||
| SWEDEN | 3879 | 6657 | ||
| TAJIKISTAN | 65 | 15 | ||
| UZBEKISTAN | 60 | 20 | ||
| ESTONIA | 140 | 62 | ||
| CYPRUS | 48 | |||
| ABKHAZIA | 3141 | 23 | ||
| LATVIA | 397 | |||
| LITHUANIA | 297 | 299 | ||
| Total | 370799 | 390730 | 19099 | 19099 |
 |
Exports of macadam to Russia by month, cumulative total, MT
| Exports by Month, cumulative totals, MT | 2016 | 2017 | 2018 |
| jan | 10552 | 19157 | 19099 |
| feb | 26806 | 43743 | |
| mar | 97810 | 70374 | |
| apr | 137490 | 108077 | |
| may | 176165 | 146549 | |
| jun | 209605 | 201336 | |
| jul | 249191 | 241842 | |
| aug | 289282 | 283333 | |
| sep | 316051 | 323459 | |
| oct | 339596 | 347407 | |
| nov | 355699 | 370428 | |
| dec | 370799 | 390730 |
 |
Imports of macadam from Russia by month, cumulative total, MT
| Imports by Month, cumulative totals, MT | 2016 | 2017 | 2018 |
| jan | 195387 | 690235 | 713235 |
| feb | 651758 | 2252971 | |
| mar | 1370926 | 3597618 | |
| apr | 2523011 | 5142246 | |
| may | 3629331 | 6664640 | |
| jun | 4822302 | 7940891 | |
| jul | 5902619 | 9153048 | |
| aug | 7178763 | 10621185 | |
| sep | 8771887 | 11912463 | |
| oct | 10242991 | 13139995 | |
| nov | 11423942 | 14412491 | |
| dec | 12274518 | 15312665 |
 |