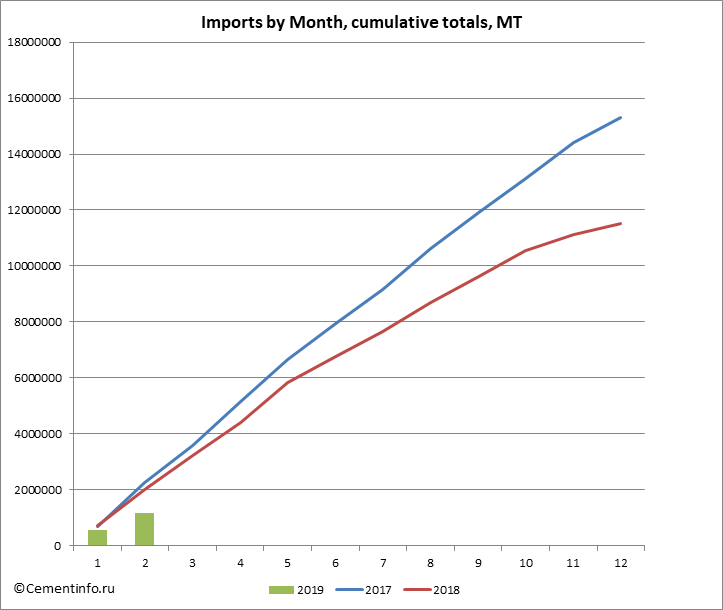
According to the analysis of customs declarations of FCS conducted by Cementinfo.ru, in February 2019 Russia has imported 610.4 thousand tons of macadam (HS code 2517). According to the results of 2 months of macadam import campaign, Russia has shipped in 1184.2 thousand tons (in 2018 - 2003.4 thousand MT; in 2017 - 2252.7 thousand MT).
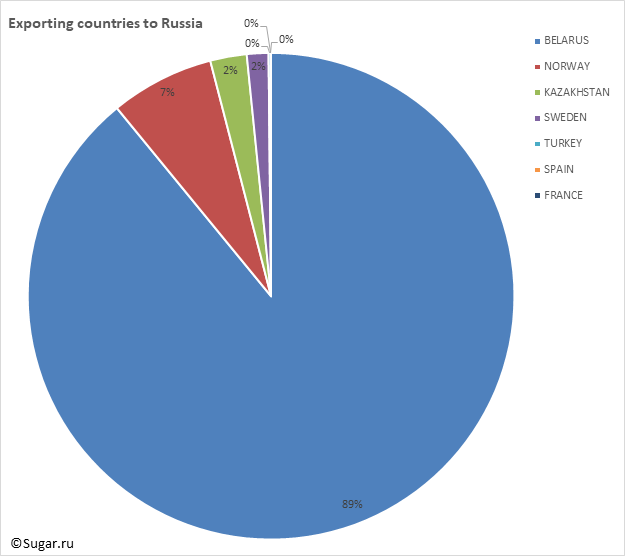
In the period January - February 2019, the main countries exporters of macadam to Russia were BELARUS (89.08%) and NORWAY (6.90%).
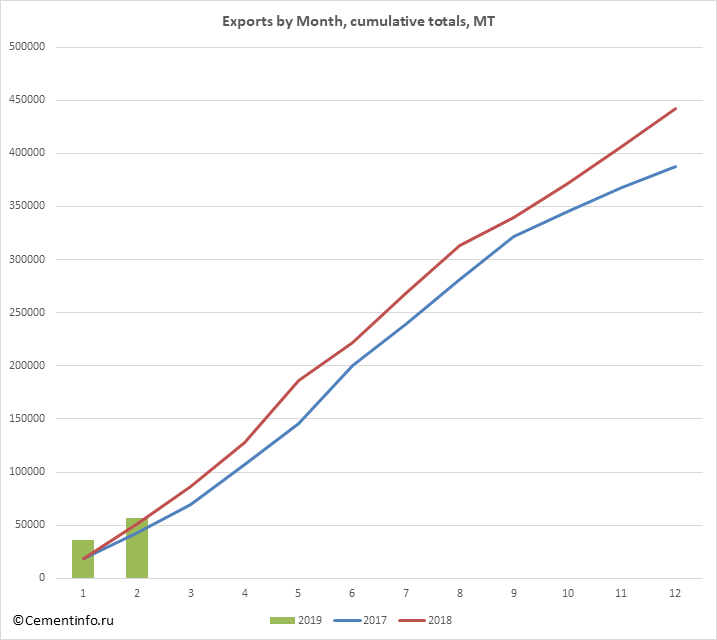
In February 2019 Russia has exported 20.9 thousand tons of macadam. According to the results of 2 months of macadam export campaign, Russia has shipped out 56.8 thousand tons (in 2018 - 51.5 thousand MT; in 2017 - 43.4 thousand MT).
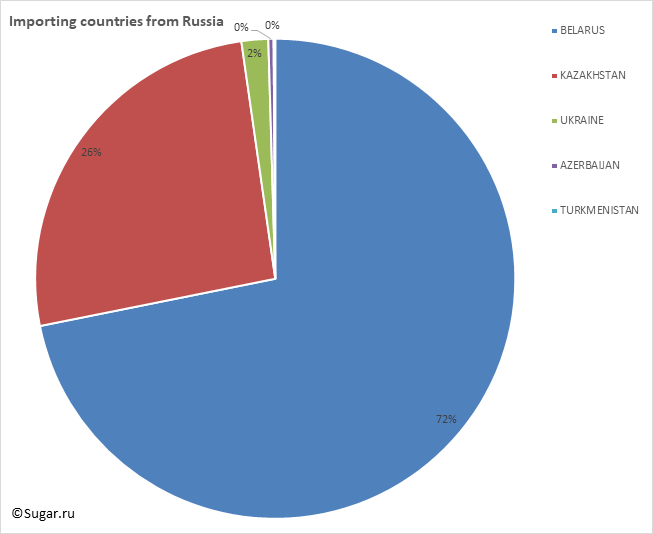
In the period January - February 2019, the main countries importers of macadam from Russia were BELARUS (71.85%) and KAZAKHSTAN (25.89%).
* the only monthly export/import of at least 60 MT is taken into account
Tables:
- Countries – exporters of macadam to Russia in January - February 2019, MT
- Countries – importers of macadam from Russia in January - February 2019, MT
- Exports of macadam to Russia by month, cumulative total, MT
- Imports of macadam from Russia by month, cumulative total, MT
Countries – exporters of macadam to Russia in January - February 2019, MT
| Exporting country to Russia, MT / year, month | 2017 | 2018 | 2019 | 2019 Total |
|
| 1 | 2 | ||||
| BELARUS | 10425230 | 7116856 | 537707 | 517079 | 1054786 |
| NORWAY | 1935569 | 945442 | 18655 | 63066 | 81721 |
| KAZAKHSTAN | 326495 | 463407 | 12489 | 16205 | 28694 |
| SWEDEN | 234214 | 175602 | 3918 | 13107 | 17025 |
| TURKEY | 72426 | 99291 | 860 | 845 | 1705 |
| SPAIN | 4292 | 1462 | 163 | 163 | |
| FRANCE | 2550 | 1957 | 60 | 60 | |
| POLAND | 964 | 159 | |||
| UNITED KINGDOM | 81967 | ||||
| ABKHAZIA | 43469 | ||||
| NETHERLANDS | 78 | ||||
| SLOVENIA | 3377 | 2800 | |||
| JAPAN | 70 | ||||
| AUSTRIA | 612 | 488 | |||
| CHINA | 498 | ||||
| FINLAND | 18238 | 3480 | |||
| UKRAINE | 2201714 | 2663497 | |||
| ESTONIA | 939 | ||||
| CZECH REPUBLIC | 317 | ||||
| ITALY | 121 | 60 | |||
| INDIA | 449 | ||||
| Total | 15310120 | 11517970 | 573792 | 610362 | 1184154 |
 |
Countries – importers of macadam from Russia in January - February 2019, MT
| Exports from Russia (breakdown by importing countries), MT | 2017 | 2018 | 2019 | 2019 Total |
|
| 1 | 2 | ||||
| BELARUS | 171731 | 282054 | 30882 | 9923 | 40805 |
| KAZAKHSTAN | 126771 | 122688 | 4423 | 10282 | 14706 |
| UKRAINE | 76216 | 25741 | 438 | 587 | 1025 |
| AZERBAIJAN | 1865 | 1969 | 130 | 70 | 200 |
| TURKMENISTAN | 320 | 60 | 60 | ||
| NORWAY | 80 | ||||
| SWEDEN | 6657 | 4041 | |||
| FINLAND | 3936 | 4505 | |||
| KYRGYZSTAN | 592 | 465 | |||
| CZECH REPUBLIC | 242 | ||||
| ABKHAZIA | 323 | ||||
| LITHUANIA | 128 | ||||
| MOLDOVA | 69 | ||||
| Total | 387975 | 442417 | 35874 | 20922 | 56796 |
 |
Exports of macadam to Russia by month, cumulative total, MT
| Exports by Month, cumulative totals, MT | 2017 | 2018 | 2019 |
| jan | 18967 | 19074 | 35874 |
| feb | 43428 | 51471 | 56796 |
| mar | 69763 | 86667 | |
| apr | 107163 | 127628 | |
| may | 145395 | 186415 | |
| jun | 199941 | 222012 | |
| jul | 240134 | 268676 | |
| aug | 281390 | 313291 | |
| sep | 321290 | 339759 | |
| oct | 345002 | 371937 | |
| nov | 367848 | 405976 | |
| dec | 387975 | 442417 |
 |
Imports of macadam from Russia by month, cumulative total, MT
| Imports by Month, cumulative totals, MT | 2017 | 2018 | 2019 |
| jan | 690173 | 732546 | 573792 |
| feb | 2252735 | 2003394 | 1184154 |
| mar | 3597297 | 3218022 | |
| apr | 5141724 | 4403776 | |
| may | 6663824 | 5830684 | |
| jun | 7939870 | 6764882 | |
| jul | 9151804 | 7672101 | |
| aug | 10619769 | 8705386 | |
| sep | 11910792 | 9620554 | |
| oct | 13137992 | 10557489 | |
| nov | 14410132 | 11118955 | |
| dec | 15310120 | 11517970 |
 |