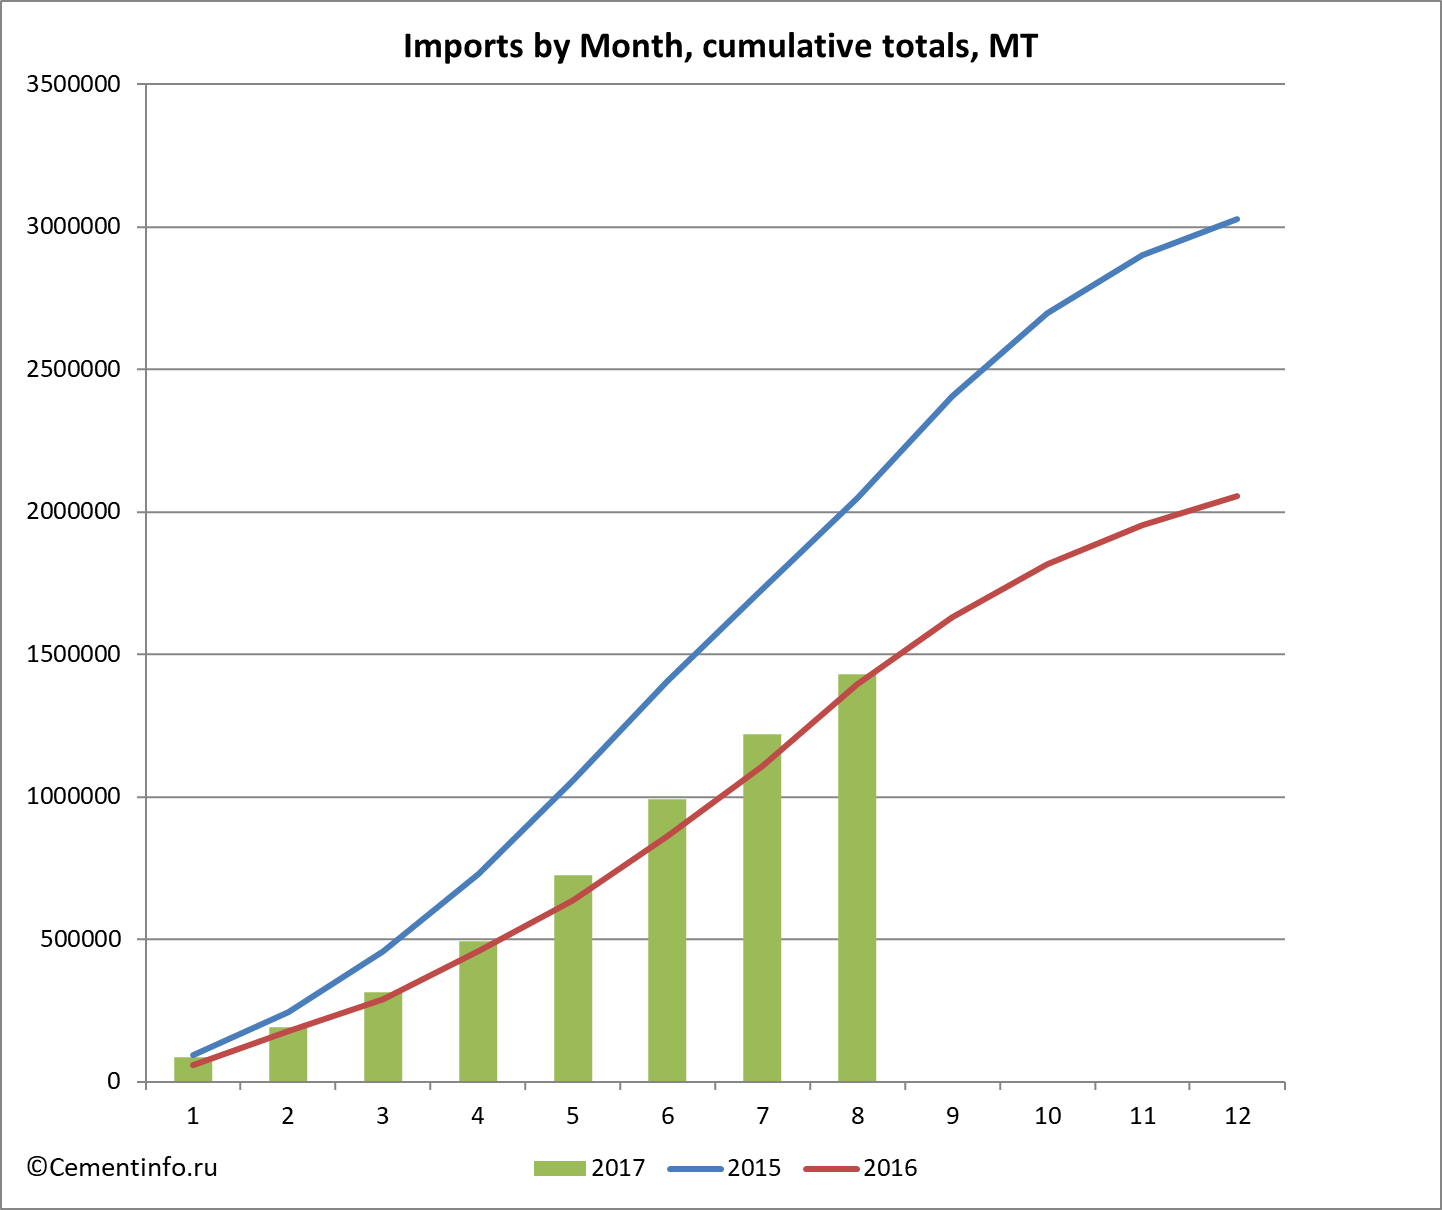
According to the analysis of customs declarations of FCS conducted by Cementinfo.ru, in August 2017 Russia has imported 211.4 thousand tons of cement. According to the results of 8 months of cement import campaign, Russia has shipped in 1431.7 thousand tons (in 2016 - 1394.8 thousand MT; in 2015 - 2048.5 thousand MT).
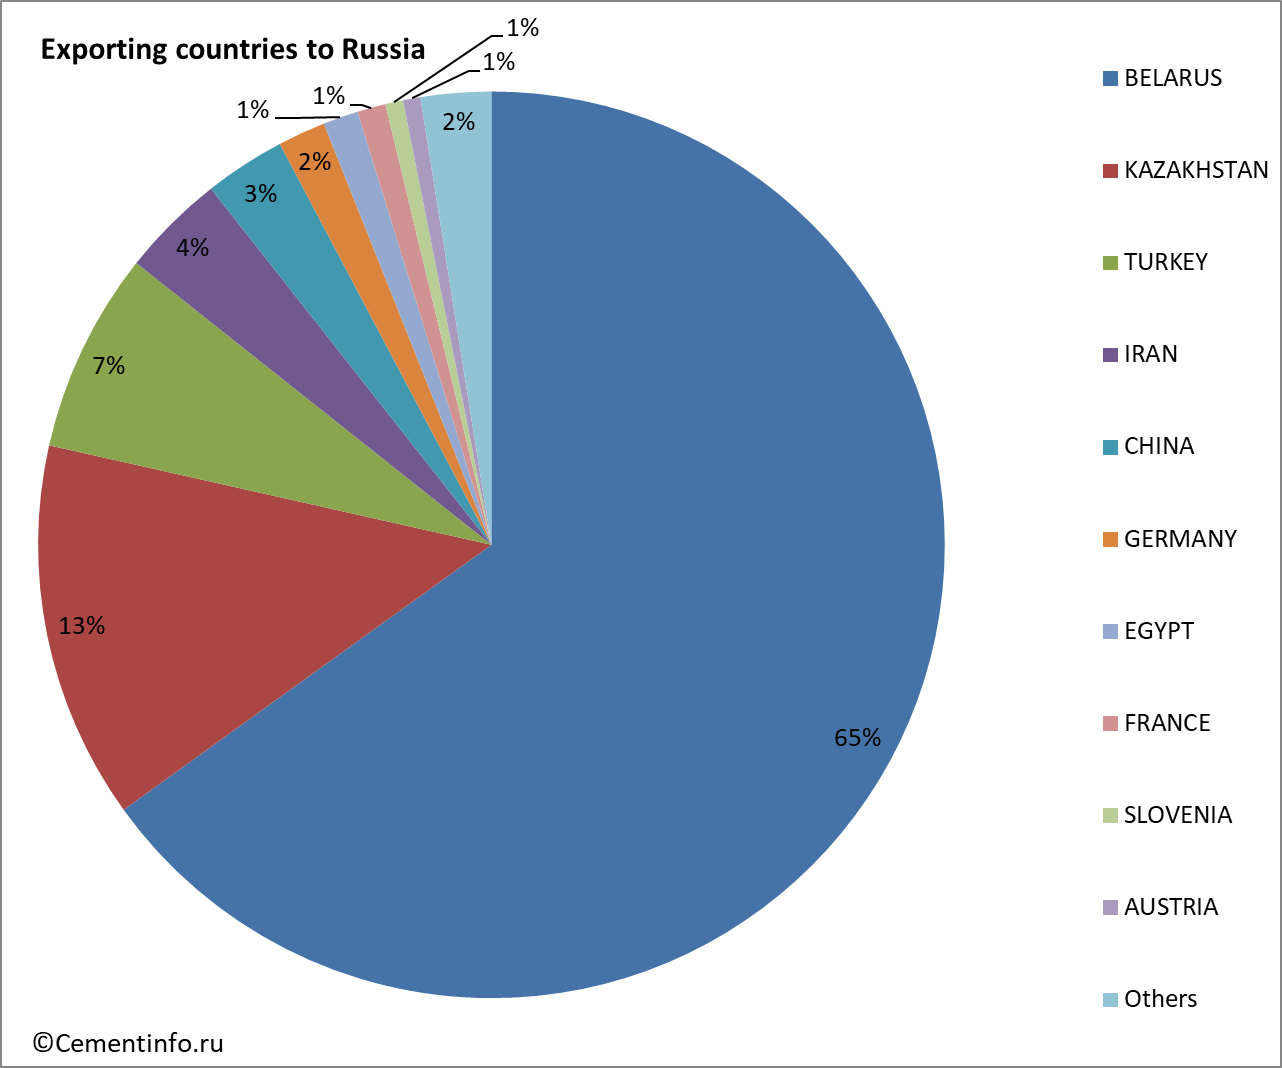
In the period January - August 2017, the main countries exporters of cement to Russia were BELARUS (65.06%) and KAZAKHSTAN (13.46%).
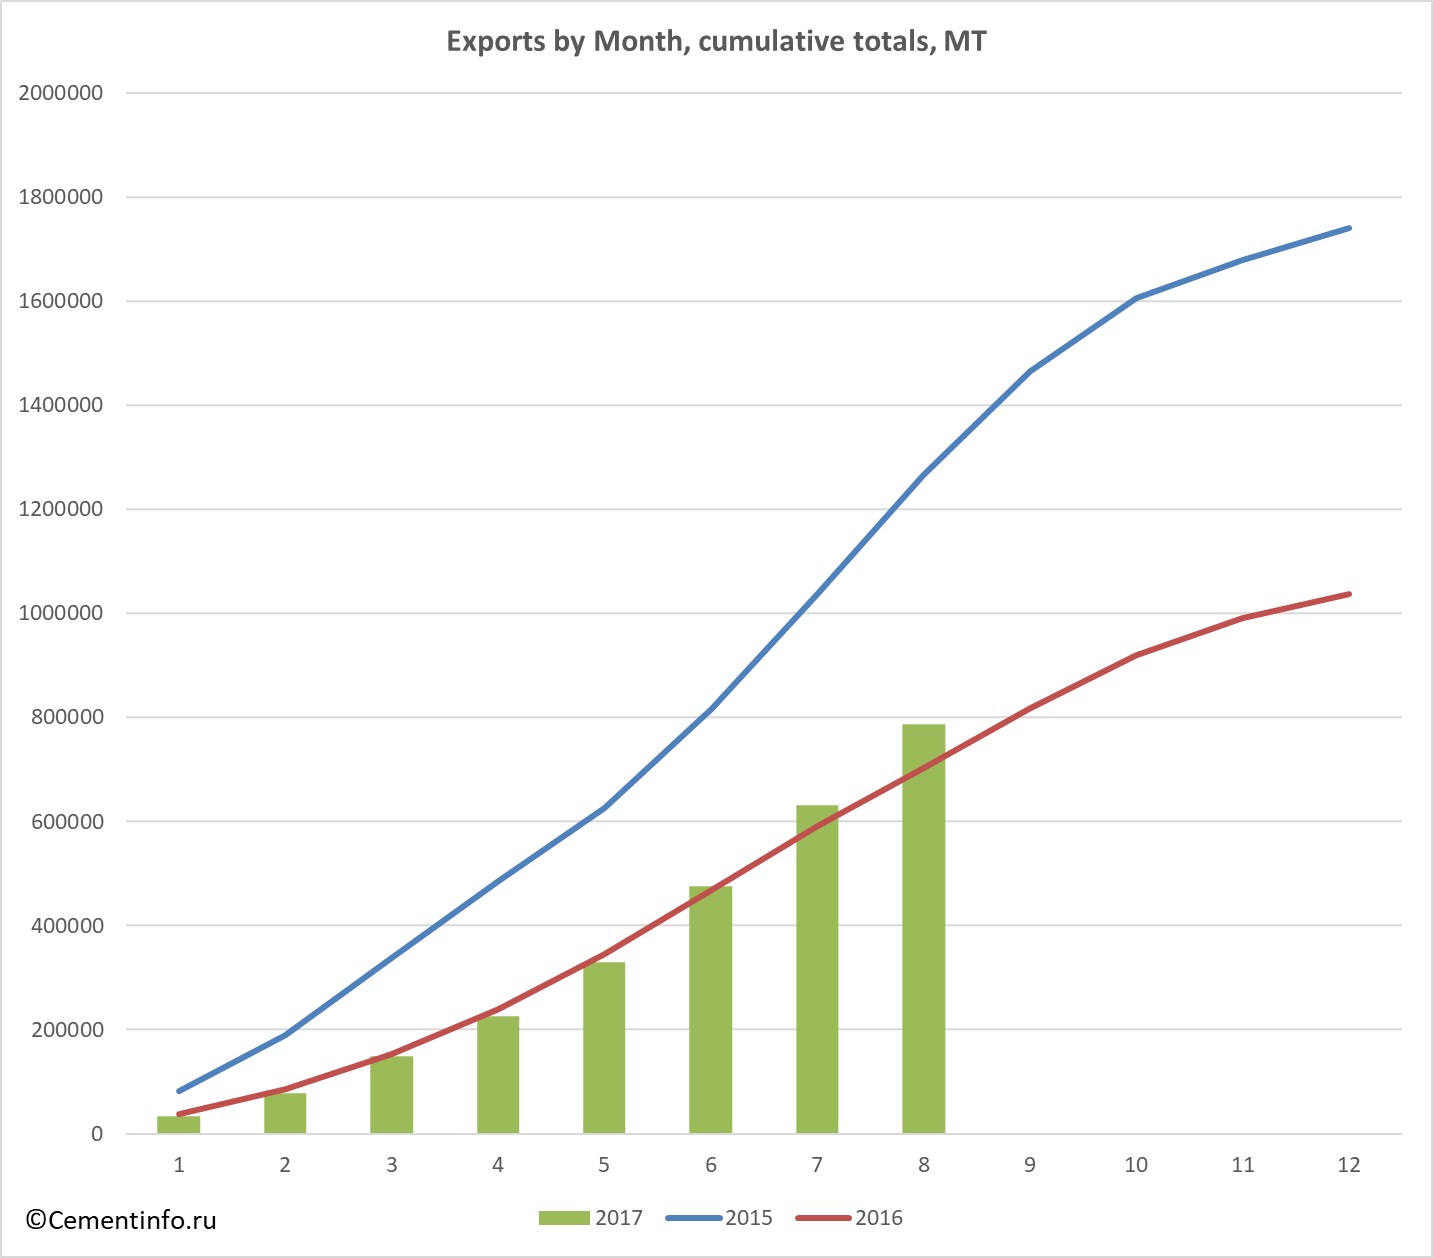
In August 2017 Russia has exported 786.6 thousand tons of cement. According to the results of 8 months of cement export campaign, Russia has shipped out 786.6 thousand tons (in 2016 - 702.9 thousand MT; in 2015 - 1265.9 thousand MT).
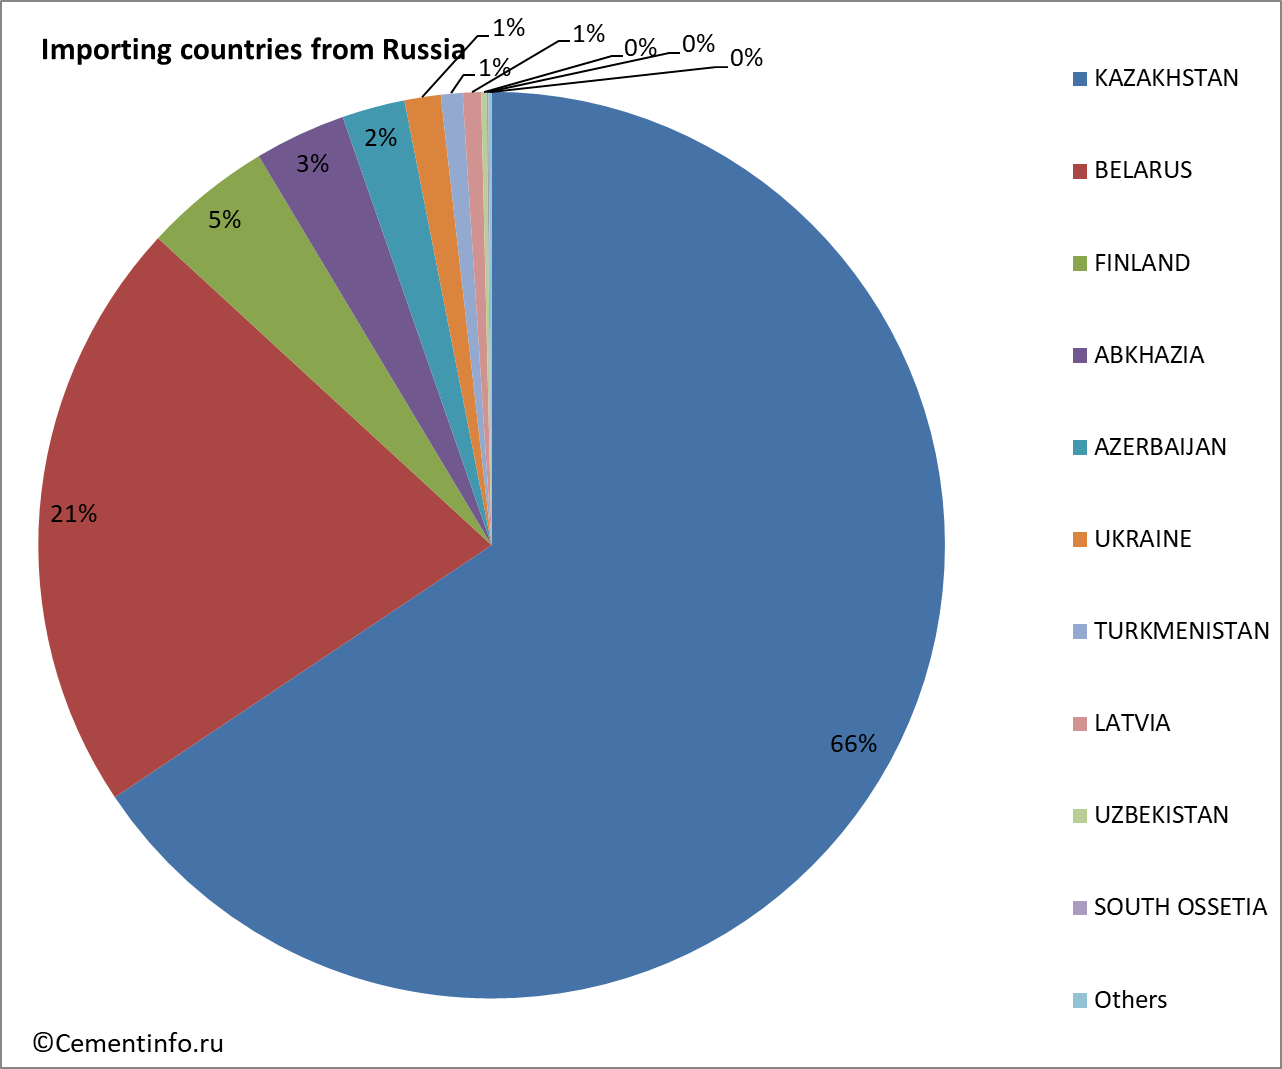
In the period January - August 2017, the main countries importers of cement from Russia were KAZAKHSTAN (65.61%) and BELARUS (21.23%)..
Tables:
- Countries – exporters of cement to Russia in January - August 2017, MT
- Countries – importers of cement from Russia in January - August 2017, MT
- Exports of cement to Russia by month, cumulative total, MT
- Imports of cement from Russia by month, cumulative total, MT
Countries – exporters of cement to Russia in January - August 2017, MT
| Exporting country to Russia, MT / year, month | 2015 | 2016 | 2017 | 2017 Total |
|||||||
| 1 | 2 | 3 | 4 | 5 | 6 | 7 | 8 | ||||
| BELARUS | 1363052 | 1412848 | 58084 | 78427 | 83897 | 117061 | 144589 | 158013 | 152211 | 139210 | 931491 |
| KAZAKHSTAN | 7392 | 208723 | 8909 | 10287 | 8298 | 32226 | 47287 | 42210 | 21198 | 22266 | 192681 |
| TURKEY | 103053 | 69381 | 345 | 152 | 3559 | 6881 | 15335 | 39190 | 24781 | 12190 | 102435 |
| IRAN | 239538 | 43246 | 4165 | 2487 | 6384 | 2994 | 4968 | 9441 | 9237 | 13385 | 53062 |
| CHINA | 78831 | 55665 | 2980 | 3494 | 5682 | 6314 | 6099 | 4143 | 5787 | 6829 | 41328 |
| GERMANY | 78870 | 41752 | 2712 | 3300 | 4141 | 3656 | 2675 | 2480 | 2971 | 2463 | 24397 |
| EGYPT | 32670 | 20993 | 2992 | 2992 | 2991 | 2993 | 2990 | 2990 | 17948 | ||
| FRANCE | 17614 | 24048 | 1250 | 1026 | 2006 | 2001 | 1953 | 897 | 1912 | 3466 | 14510 |
| SLOVENIA | 11842 | 14009 | 706 | 560 | 1449 | 1657 | 1301 | 1881 | 949 | 559 | 9062 |
| AUSTRIA | 11801 | 11585 | 927 | 1116 | 1224 | 1098 | 1060 | 1106 | 990 | 1355 | 8876 |
| GREECE | 7188 | 9784 | 503 | 1036 | 1578 | 682 | 726 | 1129 | 922 | 711 | 7287 |
| POLAND | 74623 | 10851 | 526 | 406 | 715 | 325 | 709 | 683 | 1011 | 1353 | 5728 |
| UNITED KINGDOM | 7255 | 7670 | 116 | 815 | 652 | 460 | 1054 | 209 | 1016 | 1391 | 5715 |
| SLOVAKIA | 3583 | 3587 | 453 | 626 | 392 | 262 | 235 | 190 | 344 | 367 | 2869 |
| SPAIN | 2047 | 2515 | 439 | 271 | 257 | 506 | 318 | 255 | 349 | 398 | 2792 |
| USA | 3543 | 3331 | 258 | 310 | 188 | 265 | 222 | 443 | 133 | 77 | 1896 |
| NETHERLANDS | 2274 | 1843 | 101 | 172 | 98 | 134 | 119 | 314 | 273 | 603 | 1814 |
| FINLAND | 1562 | 1461 | 62 | 81 | 142 | 109 | 142 | 127 | 104 | 239 | 1006 |
| REPUBLIC OF KOREA | 126264 | 5390 | 60 | 100 | 80 | 80 | 81 | 220 | 161 | 180 | 961 |
| ITALY | 646 | 310 | 14 | 20 | 238 | 138 | 86 | 64 | 116 | 135 | 811 |
| THAILAND | 924 | 1481 | 73 | 73 | 146 | 73 | 219 | 146 | 73 | 803 | |
| CZECH REPUBLIC | 796 | 804 | 70 | 40 | 60 | 60 | 60 | 122 | 324 | 60 | 796 |
| UKRAINE | 10000 | 68 | 27 | 34 | 13 | 49 | 189 | 81 | 398 | 791 | |
| INDIA | 243 | 166 | 310 | 719 | |||||||
| HUNGARY | 2107 | 600 | 60 | 20 | 60 | 55 | 55 | 115 | 60 | 425 | |
| IRELAND | 336 | 180 | 45 | 120 | 120 | 45 | 330 | ||||
| SERBIA | 66 | 66 | 66 | 132 | 330 | ||||||
| LATVIA | 290592 | 30825 | 54 | 18 | 20 | 155 | 70 | 318 | |||
| CROATIA | 126 | 21 | 20 | 60 | 120 | 200 | |||||
| SWEDEN | 102165 | 8196 | 76 | 20 | 28 | 124 | |||||
| SWITZERLAND | 120 | 120 | |||||||||
| LITHUANIA | 293470 | 57051 | 21 | 21 | |||||||
| JAPAN | 60 | 16 | 16 | ||||||||
| BELGIUM | 23 | 15 | 15 | ||||||||
| TURKMENISTAN | 335 | ||||||||||
| MONGOLIA | 10464 | ||||||||||
| South Africa | 4000 | ||||||||||
| ESTONIA | 9799 | 96 | |||||||||
| ARMENIA | 858 | ||||||||||
| UNITED ARAB EMIRATES | 58 | ||||||||||
| NORWAY | 84300 | 6500 | |||||||||
| BULGARIA | 25972 | ||||||||||
| SAUDI ARABIA | 32 | ||||||||||
| TAIWAN | 22 | 18 | |||||||||
| DENMARK | 18975 | ||||||||||
| MALAYSIA | 43 | ||||||||||
| Total | 3028909 | 2055025 | 85983 | 104919 | 124371 | 180276 | 229404 | 266910 | 228424 | 211389 | 1431676 |
 |
Countries – importers of cement from Russia in January - August 2017, MT
| Exports from Russia (breakdown by importing countries), MT | 2015 | 2016 | 2017 | 2017 Total |
|||||||
| 1 | 2 | 3 | 4 | 5 | 6 | 7 | 8 | ||||
| KAZAKHSTAN | 1163513 | 562265 | 19635 | 27973 | 37025 | 48447 | 70494 | 104399 | 101658 | 106476 | 516106 |
| BELARUS | 434197 | 254965 | 3191 | 5115 | 19750 | 18180 | 20216 | 28796 | 34699 | 37045 | 166993 |
| FINLAND | 22463 | 83916 | 2231 | 3045 | 4093 | 5960 | 5415 | 10149 | 5088 | 35980 | |
| ABKHAZIA | 62214 | 83747 | 3418 | 3916 | 5073 | 3659 | 1886 | 2879 | 3432 | 1364 | 25628 |
| AZERBAIJAN | 31998 | 19545 | 1921 | 1403 | 2673 | 3034 | 2162 | 2420 | 2283 | 1767 | 17665 |
| UKRAINE | 6443 | 16588 | 753 | 644 | 1455 | 760 | 1658 | 2324 | 1076 | 1474 | 10144 |
| TURKMENISTAN | 7323 | 4451 | 1206 | 1682 | 411 | 680 | 469 | 804 | 804 | 6056 | |
| LATVIA | 935 | 5226 | 415 | 306 | 532 | 1809 | 1054 | 237 | 310 | 460 | 5123 |
| UZBEKISTAN | 1337 | 972 | 234 | 60 | 67 | 465 | 724 | 1550 | |||
| SOUTH OSSETIA | 5974 | 2892 | 44 | 10 | 89 | 32 | 44 | 41 | 213 | 473 | |
| SERBIA | 123 | 186 | 123 | 63 | 21 | 42 | 249 | ||||
| FAROE ISLANDS | 70 | 201 | 201 | ||||||||
| ESTONIA | 317 | 73 | 40 | 57 | 26 | 20 | 143 | ||||
| ARMENIA | 57 | 22 | 13 | 15 | 25 | 28 | 13 | 115 | |||
| TAJIKISTAN | 125 | 70 | 60 | 60 | |||||||
| NORWAY | 17 | 54 | 54 | ||||||||
| KYRGYZSTAN | 1400 | 1820 | 10 | 13 | 23 | ||||||
| UNITED KINGDOM | 22 | 22 | |||||||||
| AFGHANISTAN | 17 | 17 | |||||||||
| NETHERLANDS | 11 | 11 | |||||||||
| LITHUANIA | 62 | ||||||||||
| INDIA | 13 | ||||||||||
| KOREA (DPRK) | 207 | 483 | |||||||||
| POLAND | 18 | ||||||||||
| ALBANIA | 10 | ||||||||||
| GEORGIA | 639 | ||||||||||
| GERMANY | 13 | ||||||||||
| AUSTRIA | 40 | ||||||||||
| AUSTRALIA | 24 | ||||||||||
| MOLDOVA | 13 | 20 | |||||||||
| MONGOLIA | 719 | 334 | |||||||||
| Total | 1740026 | 1037792 | 33081 | 44178 | 71387 | 76657 | 104216 | 147056 | 154561 | 155477 | 786613 |
 |
Exports of cement to Russia by month, cumulative total, MT
| Exports by Month, cumulative totals, MT | 2015 | 2016 | 2017 |
| jan | 81481 | 37859 | 33081 |
| feb | 189484 | 85860 | 77258 |
| mar | 338117 | 152888 | 148645 |
| apr | 485015 | 238730 | 225302 |
| may | 625026 | 344949 | 329519 |
| jun | 816069 | 469054 | 476575 |
| jul | 1037163 | 591740 | 631137 |
| aug | 1265872 | 702902 | 786613 |
| sep | 1465485 | 818872 | |
| oct | 1605785 | 920582 | |
| nov | 1679137 | 991255 | |
| dec | 1740026 | 1037792 |
 |
Imports of cement from Russia by month, cumulative total, MT
| Imports by Month, cumulative totals, MT | 2015 | 2016 | 2017 |
| jan | 94469 | 58857 | 85983 |
| feb | 245186 | 176889 | 190902 |
| mar | 458394 | 290794 | 315274 |
| apr | 729536 | 457719 | 495549 |
| may | 1059984 | 638012 | 724954 |
| jun | 1405504 | 862163 | 991863 |
| jul | 1730162 | 1106863 | 1220287 |
| aug | 2048512 | 1394826 | 1431676 |
| sep | 2406033 | 1629175 | |
| oct | 2697387 | 1816814 | |
| nov | 2899806 | 1954962 | |
| dec | 3028909 | 2055025 |
 |
