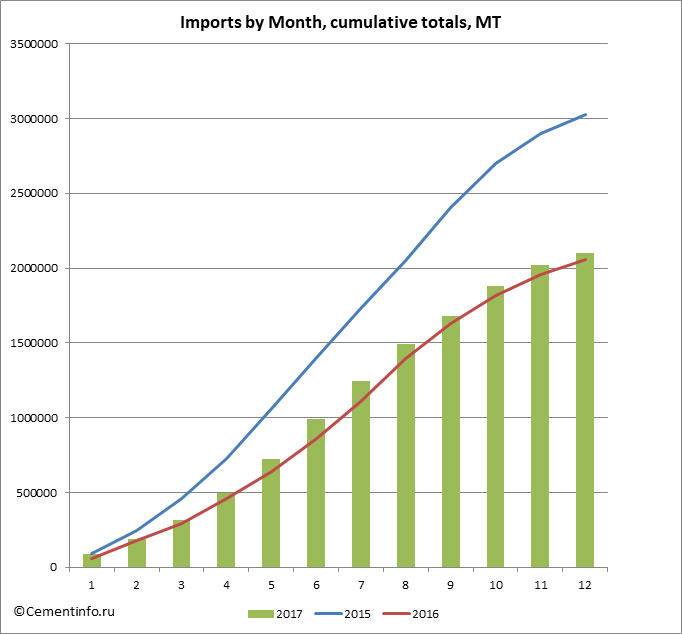
According to the analysis of customs declarations of FCS conducted by Cementinfo.ru, in December 2017 Russia has imported 85.4 thousand tons of cement. According to the results of 12 months of cement import campaign, Russia has shipped in 2103.9 thousand tons (in 2016 - 2055.0 thousand MT; in 2015 - 3028.9 thousand MT).
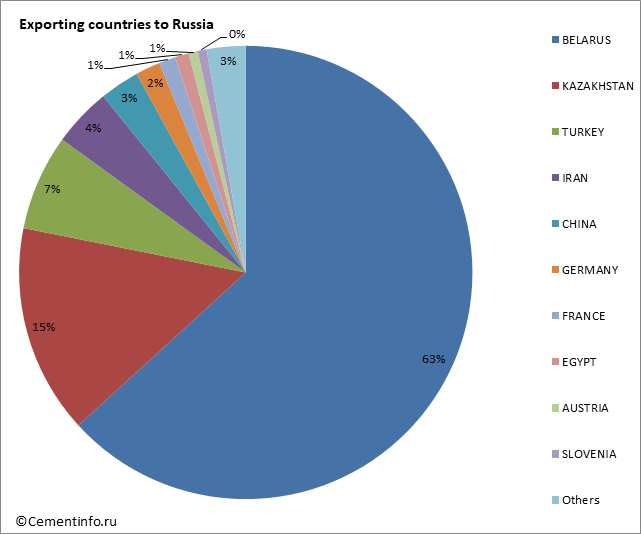
In the period January - December 2017, the main countries exporters of cement to Russia were BELARUS (63.22%) and KAZAKHSTAN (14.92%).
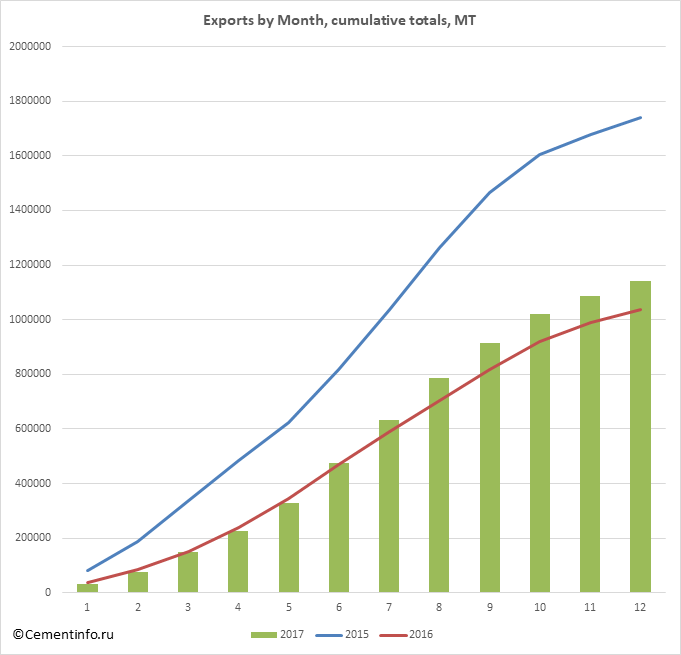
In December 2017 Russia has exported 1141.0 thousand tons of cement. According to the results of 12 months of cement export campaign, Russia has shipped out 1141.0 thousand tons (in 2016 - 1037.8 thousand MT; in 2015 - 1740.0 thousand MT).
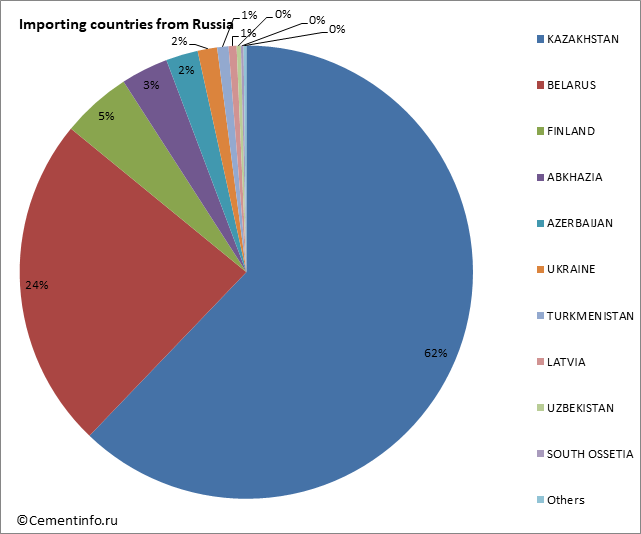
In the period January - December 2017, the main countries importers of cement from Russia were KAZAKHSTAN (62.17%) and BELARUS (23.75%)..
Tables:
- Countries – exporters of cement to Russia in January - December 2017, MT
- Countries – importers of cement from Russia in January - December 2017, MT
- Exports of cement to Russia by month, cumulative total, MT
- Imports of cement from Russia by month, cumulative total, MT
Countries – exporters of cement to Russia in January - December 2017, MT
| Exporting country to Russia, MT / year, month | 2015 | 2016 | 2017 | 2017 Total |
|||||||||||
| 1 | 2 | 3 | 4 | 5 | 6 | 7 | 8 | 9 | 10 | 11 | 12 | ||||
| BELARUS | 1363052 | 1412848 | 58084 | 78427 | 83897 | 117061 | 144589 | 158013 | 152935 | 148224 | 121316 | 133173 | 83795 | 50704 | 1330217 |
| KAZAKHSTAN | 7392 | 208723 | 8909 | 10287 | 8298 | 32226 | 47287 | 42210 | 46882 | 47683 | 18313 | 27858 | 16407 | 7464 | 313825 |
| TURKEY | 103053 | 69381 | 345 | 152 | 3559 | 6881 | 15335 | 39190 | 24781 | 12190 | 19215 | 12120 | 9214 | 817 | 143801 |
| IRAN | 239538 | 43246 | 4165 | 2487 | 6384 | 2994 | 4968 | 9441 | 9237 | 13385 | 13800 | 5939 | 8269 | 7299 | 88368 |
| CHINA | 78831 | 55665 | 2980 | 3494 | 5682 | 6314 | 6099 | 4143 | 5787 | 6829 | 3315 | 4473 | 4798 | 5643 | 59556 |
| GERMANY | 78870 | 41752 | 2712 | 3300 | 4141 | 3656 | 2675 | 2480 | 2971 | 2463 | 3650 | 3547 | 3020 | 2545 | 37159 |
| FRANCE | 17614 | 24048 | 1250 | 1026 | 2006 | 2001 | 1953 | 897 | 1912 | 3466 | 2452 | 3104 | 2715 | 1957 | 24737 |
| EGYPT | 32670 | 20993 | 2992 | 2992 | 2991 | 2993 | 2990 | 2990 | 2995 | 20943 | |||||
| AUSTRIA | 11801 | 11585 | 927 | 1116 | 1224 | 1098 | 1060 | 1106 | 990 | 1355 | 964 | 1340 | 898 | 1586 | 13664 |
| SLOVENIA | 11842 | 14009 | 706 | 560 | 1449 | 1657 | 1301 | 1881 | 949 | 559 | 910 | 1047 | 1126 | 1210 | 13355 |
| GREECE | 7188 | 9784 | 503 | 1036 | 1578 | 682 | 726 | 1129 | 922 | 711 | 938 | 1029 | 888 | 2039 | 12181 |
| UNITED KINGDOM | 7255 | 7670 | 116 | 815 | 652 | 460 | 1054 | 209 | 1016 | 1391 | 1364 | 836 | 1346 | 929 | 10190 |
| POLAND | 74623 | 10851 | 526 | 406 | 715 | 325 | 709 | 683 | 1011 | 1353 | 488 | 985 | 701 | 541 | 8443 |
| SPAIN | 2047 | 2515 | 439 | 271 | 257 | 506 | 318 | 255 | 349 | 398 | 413 | 336 | 804 | 812 | 5157 |
| SLOVAKIA | 3583 | 3587 | 453 | 626 | 392 | 262 | 235 | 190 | 344 | 367 | 375 | 369 | 446 | 154 | 4214 |
| USA | 3543 | 3331 | 258 | 310 | 188 | 265 | 222 | 443 | 133 | 77 | 127 | 19 | 288 | 119 | 2450 |
| NETHERLANDS | 2274 | 1843 | 101 | 172 | 98 | 134 | 119 | 314 | 273 | 603 | 163 | 220 | 64 | 97 | 2359 |
| UKRAINE | 10000 | 68 | 27 | 34 | 13 | 49 | 189 | 81 | 398 | 260 | 190 | 80 | 313 | 1634 | |
| REPUBLIC OF KOREA | 126264 | 5390 | 60 | 100 | 80 | 80 | 81 | 220 | 161 | 180 | 60 | 241 | 100 | 201 | 1563 |
| FINLAND | 1562 | 1461 | 62 | 81 | 142 | 109 | 142 | 127 | 104 | 239 | 174 | 63 | 144 | 168 | 1555 |
| CZECH REPUBLIC | 796 | 804 | 70 | 40 | 60 | 60 | 60 | 122 | 324 | 60 | 61 | 194 | 81 | 301 | 1434 |
| ITALY | 646 | 310 | 14 | 20 | 238 | 138 | 86 | 64 | 116 | 135 | 51 | 446 | 67 | 39 | 1416 |
| THAILAND | 924 | 1481 | 73 | 73 | 146 | 73 | 219 | 146 | 73 | 73 | 73 | 73 | 146 | 1167 | |
| INDIA | 243 | 166 | 310 | 410 | 1129 | ||||||||||
| HUNGARY | 2107 | 600 | 60 | 20 | 60 | 55 | 55 | 115 | 60 | 420 | 16 | 861 | |||
| LATVIA | 290592 | 30825 | 54 | 18 | 20 | 155 | 70 | 91 | 171 | 15 | 132 | 727 | |||
| SERBIA | 66 | 66 | 66 | 132 | 132 | 66 | 132 | 66 | 726 | ||||||
| IRELAND | 336 | 180 | 45 | 120 | 120 | 45 | 45 | 45 | 420 | ||||||
| CROATIA | 126 | 21 | 20 | 60 | 120 | 20 | 20 | 40 | 280 | ||||||
| SWEDEN | 102165 | 8196 | 76 | 20 | 28 | 124 | |||||||||
| SWITZERLAND | 120 | 120 | |||||||||||||
| LITHUANIA | 293470 | 57051 | 21 | 40 | 61 | ||||||||||
| South Africa | 4000 | 40 | 40 | ||||||||||||
| BELGIUM | 23 | 15 | 11 | 26 | |||||||||||
| JAPAN | 60 | 16 | 16 | ||||||||||||
| EUROPEAN UNION | 15 | 15 | |||||||||||||
| ESTONIA | 9799 | 96 | 11 | 11 | |||||||||||
| ARMENIA | 858 | ||||||||||||||
| TAIWAN | 22 | 18 | |||||||||||||
| TURKMENISTAN | 335 | ||||||||||||||
| NORWAY | 84300 | 6500 | |||||||||||||
| BULGARIA | 25972 | ||||||||||||||
| UNITED ARAB EMIRATES | 58 | ||||||||||||||
| SAUDI ARABIA | 32 | ||||||||||||||
| MONGOLIA | 10464 | ||||||||||||||
| MALAYSIA | 43 | ||||||||||||||
| DENMARK | 18975 | ||||||||||||||
| Total | 3028909 | 2055025 | 85983 | 104919 | 124371 | 180276 | 229404 | 266910 | 254832 | 245820 | 189200 | 201286 | 135525 | 85417 | 2103944 |
 |
Countries – importers of cement from Russia in January - December 2017, MT
| Exports from Russia (breakdown by importing countries), MT | 2015 | 2016 | 2017 | 2017 Total |
|||||||||||
| 1 | 2 | 3 | 4 | 5 | 6 | 7 | 8 | 9 | 10 | 11 | 12 | ||||
| KAZAKHSTAN | 1163513 | 562265 | 19635 | 27973 | 37025 | 48447 | 70494 | 104399 | 101658 | 106476 | 77828 | 53967 | 32746 | 28727 | 709374 |
| BELARUS | 434197 | 254965 | 3191 | 5115 | 19750 | 18180 | 20216 | 28796 | 34699 | 37208 | 38111 | 35656 | 17523 | 12504 | 270950 |
| FINLAND | 22463 | 83916 | 2231 | 3045 | 4093 | 5960 | 5415 | 10149 | 5088 | 3734 | 6554 | 6507 | 3958 | 56734 | |
| ABKHAZIA | 62214 | 83747 | 3418 | 3916 | 5073 | 3659 | 1886 | 2879 | 3432 | 1364 | 2639 | 4333 | 3056 | 2846 | 38502 |
| AZERBAIJAN | 31998 | 19545 | 1921 | 1403 | 2673 | 3034 | 2162 | 2420 | 2283 | 1767 | 3504 | 1678 | 1388 | 1868 | 26103 |
| UKRAINE | 6443 | 16588 | 753 | 644 | 1455 | 760 | 1658 | 2324 | 1076 | 1474 | 1713 | 1545 | 1048 | 1408 | 15859 |
| TURKMENISTAN | 7323 | 4451 | 1206 | 1682 | 411 | 680 | 469 | 804 | 804 | 402 | 1206 | 1541 | 9205 | ||
| LATVIA | 935 | 5226 | 415 | 306 | 532 | 1809 | 1054 | 237 | 310 | 460 | 620 | 642 | 24 | 47 | 6456 |
| UZBEKISTAN | 1337 | 972 | 234 | 60 | 67 | 465 | 724 | 612 | 299 | 399 | 598 | 3458 | |||
| SOUTH OSSETIA | 5974 | 2892 | 44 | 10 | 89 | 32 | 44 | 41 | 213 | 175 | 680 | 583 | 234 | 2146 | |
| SERBIA | 123 | 186 | 123 | 63 | 21 | 42 | 42 | 62 | 42 | 145 | 540 | ||||
| KYRGYZSTAN | 1400 | 1820 | 10 | 13 | 40 | 277 | 149 | 489 | |||||||
| FAROE ISLANDS | 70 | 201 | 201 | 402 | |||||||||||
| ARMENIA | 57 | 22 | 13 | 15 | 25 | 28 | 13 | 37 | 22 | 44 | 22 | 240 | |||
| ESTONIA | 317 | 73 | 40 | 57 | 26 | 20 | 33 | 20 | 21 | 218 | |||||
| TAJIKISTAN | 125 | 70 | 60 | 43 | 33 | 136 | |||||||||
| LITHUANIA | 62 | 125 | 125 | ||||||||||||
| NORWAY | 17 | 54 | 54 | ||||||||||||
| UNITED KINGDOM | 22 | 22 | |||||||||||||
| AFGHANISTAN | 17 | 17 | |||||||||||||
| NETHERLANDS | 11 | 11 | |||||||||||||
| POLAND | 18 | ||||||||||||||
| ALBANIA | 10 | ||||||||||||||
| KOREA (DPRK) | 207 | 483 | |||||||||||||
| AUSTRALIA | 24 | ||||||||||||||
| AUSTRIA | 40 | ||||||||||||||
| INDIA | 13 | ||||||||||||||
| GERMANY | 13 | ||||||||||||||
| GEORGIA | 639 | ||||||||||||||
| MOLDOVA | 13 | 20 | |||||||||||||
| MONGOLIA | 719 | 334 | |||||||||||||
| Total | 1740026 | 1037792 | 33081 | 44178 | 71387 | 76657 | 104216 | 147056 | 154561 | 155640 | 129249 | 105880 | 64906 | 54227 | 1141038 |
 |
Exports of cement to Russia by month, cumulative total, MT
| Exports by Month, cumulative totals, MT | 2015 | 2016 | 2017 |
| jan | 81481 | 37859 | 33081 |
| feb | 189484 | 85860 | 77258 |
| mar | 338117 | 152888 | 148645 |
| apr | 485015 | 238730 | 225302 |
| may | 625026 | 344949 | 329519 |
| jun | 816069 | 469054 | 476575 |
| jul | 1037163 | 591740 | 631137 |
| aug | 1265872 | 702902 | 786776 |
| sep | 1465485 | 818872 | 916025 |
| oct | 1605785 | 920582 | 1021905 |
| nov | 1679137 | 991255 | 1086811 |
| dec | 1740026 | 1037792 | 1141038 |
 |
Imports of cement from Russia by month, cumulative total, MT
| Imports by Month, cumulative totals, MT | 2015 | 2016 | 2017 |
| jan | 94469 | 58857 | 85983 |
| feb | 245186 | 176889 | 190902 |
| mar | 458394 | 290794 | 315274 |
| apr | 729536 | 457719 | 495549 |
| may | 1059984 | 638012 | 724954 |
| jun | 1405504 | 862163 | 991863 |
| jul | 1730162 | 1106863 | 1246695 |
| aug | 2048512 | 1394826 | 1492515 |
| sep | 2406033 | 1629175 | 1681715 |
| oct | 2697387 | 1816814 | 1883002 |
| nov | 2899806 | 1954962 | 2018527 |
| dec | 3028909 | 2055025 | 2103944 |
 |